The identification and monitoring of terrorist or criminal networks are crucial activities to detect threats. But with bigger datasets, new data types and threats that evolve quickly, conducting network intelligence analysis has become increasingly challenging. In this article, you’ll see how graph visualization and analytics can help network intelligence analysis activities by identifying and tracking suspicious individuals and their connections.
Criminal and terrorist activities are rarely carried out by isolated individuals. Behind terrorism and major crime are more or less centralized organizations or networks. Intelligence analysts are responsible for identifying every member of such groups. Getting the whole picture of the network is essential to monitor suspicious activities, prevent attacks and detect new potential threats. But criminals go to great lengths to hide any connections to a network, using encrypted communication services, numerous middlemen, fake identities, etc.
Countering crime and terrorism today also requires gathering information from various sources. The logic tends to be that the more data intelligence and security organizations are able to obtain, the more likely they are to gather a clue needed to identify criminal or terrorist activities. Handling large sets of heterogeneous data, though, can be very challenging without the right tools.
While traditional methods showed limits in making sense of large datasets, graph-based intelligence analysis proved to be particularly effective. Graph databases allow organizations to store and query in near real-time the relationships between billions of entities. Let’s see how these systems, combined with network visualization tools like Linkurious Enterprise, can help intelligence analysts identify and investigate threats.
To understand how to apply graph to intelligence analysis to help identify and investigate suspicious networks, we’ll take the example of the investigation of a potential terrorist threat.
For this purpose, we have created a dataset with fictitious data about people, including addresses, phone numbers and travel information. This data can easily be modeled as a graph:
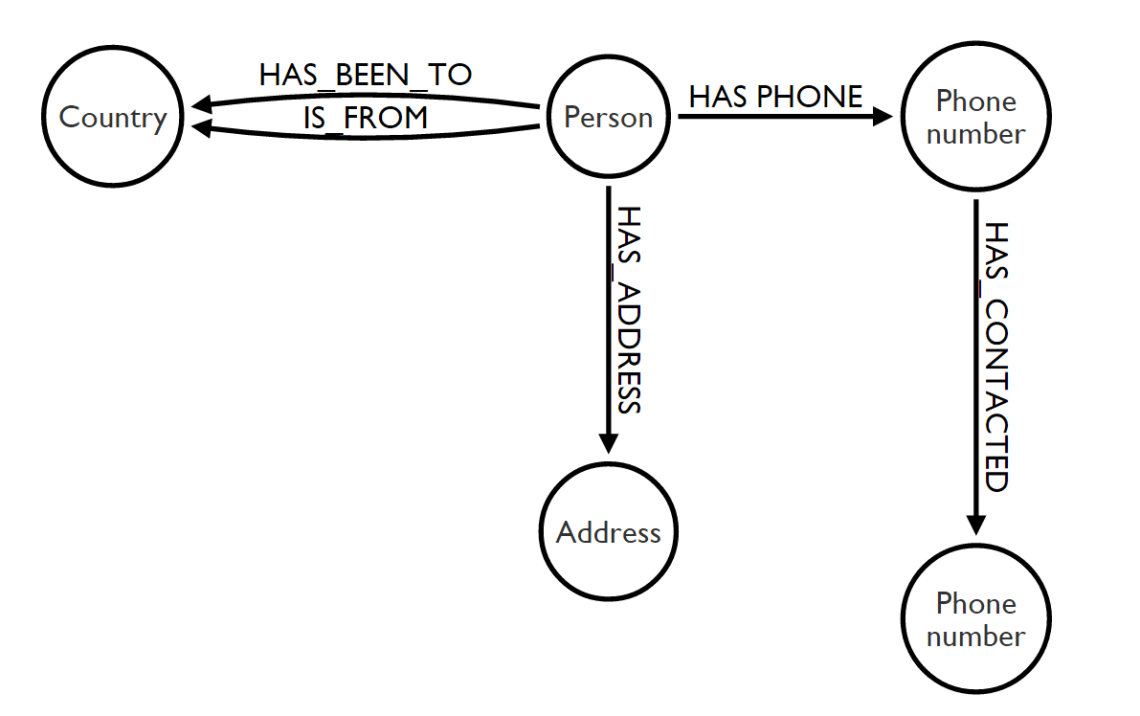
To keep our analysis understandable, we chose a very simple model with a limited volume of data. A real-life situation would involve larger volumes and a wider range of data types.
As depicted above, entities such as individuals, emails, and phone numbers are modeled as nodes. Relationships between entities are represented as edges and labeled with the nature of the connection. The data then forms a network.
Let’s start our investigation by trying to detect suspicious patterns in our data.
When working with large datasets, we need to find ways to focus the analyst’s attention on relevant information. Here we want to detect potential terrorist cells. We are going to try to detect groups of at least three people who 1) visited an at-risk country (in this case Syria) and 2) are indirectly in contact via their addresses or phone communications.
With a simple Cypher query, users can set up a monitoring activity for chosen patterns. Below is the script we will use to identify our pattern:
// Detecting threats:
MATCH (a:Person)-[s:HAS_CONTACTED|HAS_PHONE|HAS_ADDRESS*..10]-(b:Person)-[:HAS_BEEN_TO]->(d:Country {name:’Syria’})
WITH a, collect(s) as rels,collect(distinct b) as suspects,d,count(distinct b) as score
WHERE score > 2
RETURN a,suspects
ORDER BY score DESC
Linkurious Enterprise reported three individuals in the database with an activity matching the pattern: Jessica Wells, Bobby Murphy, and Ruth Warren. In a click, analysts can visualize the individuals and how they are interconnected. Jessica, Bobby and Ruth display a “has been to” relationship with Syria and appear to be connected to a unique phone number: Judy Lewis’.
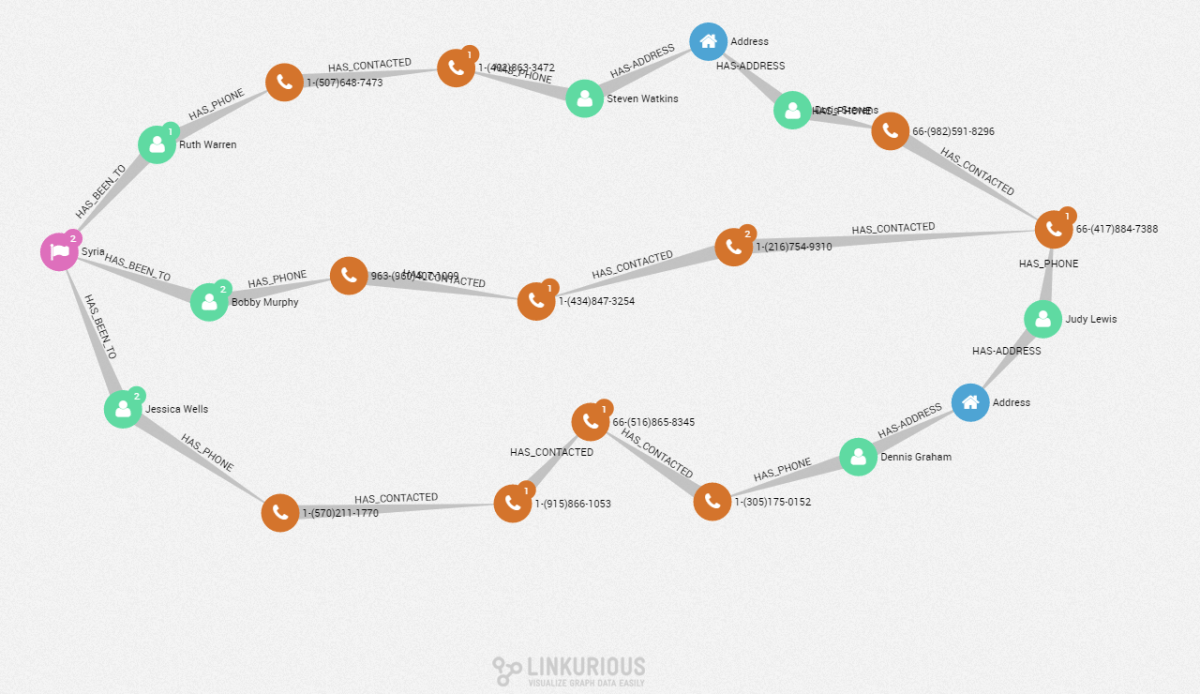
Several nodes connect these three people to Judy’s phone number. Phone calls and addresses are the bridges enabling the connection between our individuals. For analysts, this particular pattern could be pointing toward a recruiting network, with numerous middlemen to avoid detection. Those results could lead to specific recommendations and further investigations.
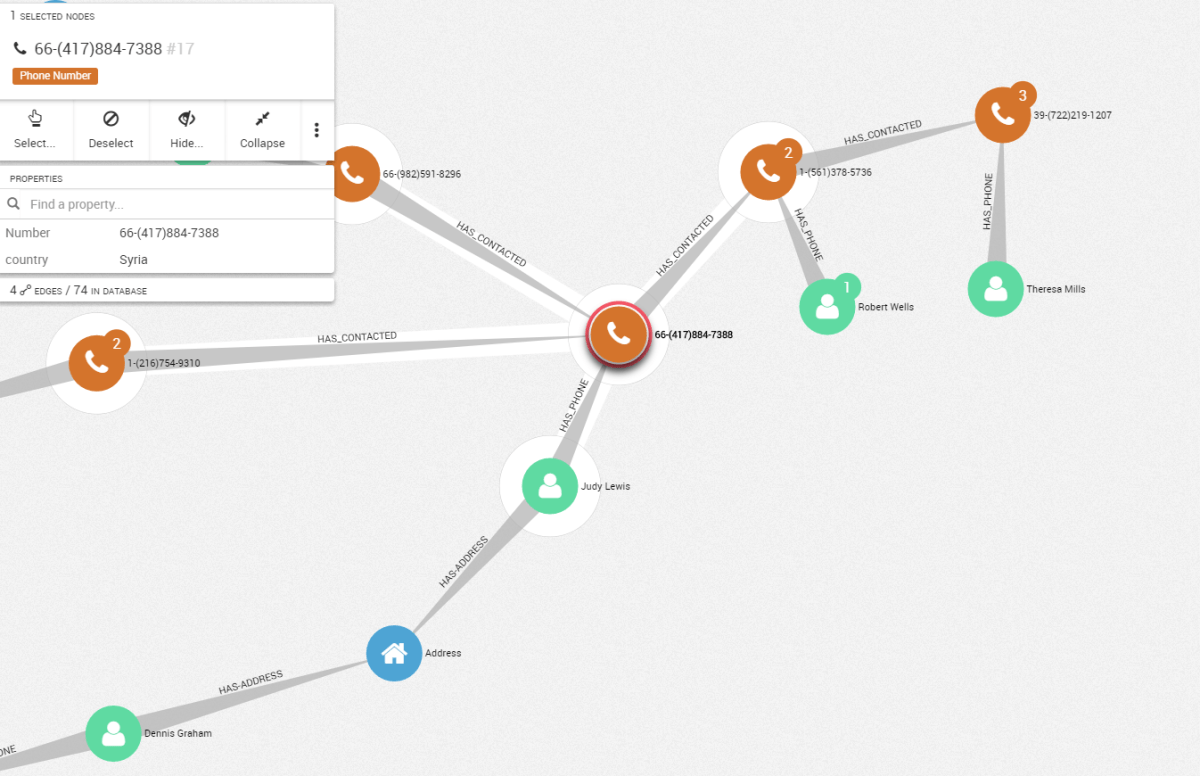
A graph approach provides the opportunity to detect specific cross-data patterns when conducting network intelligence analysis. Even if real-life data would be more complex, with Linkurious Enterprise, it’s easy to visualize and understand both the network and the relationship between its members. Graph visualizations combine all the available information into a single representation. Some of the nodes here seem to be connected to other entities. Linkurious Enterprise allows analysts to interactively explore the data and uncover new information.
We identified a potential network with several people. Do they have accomplices? We can investigate further, starting from one node within the network. Let’s pick Judy’s phone number and extend the nodes around it.
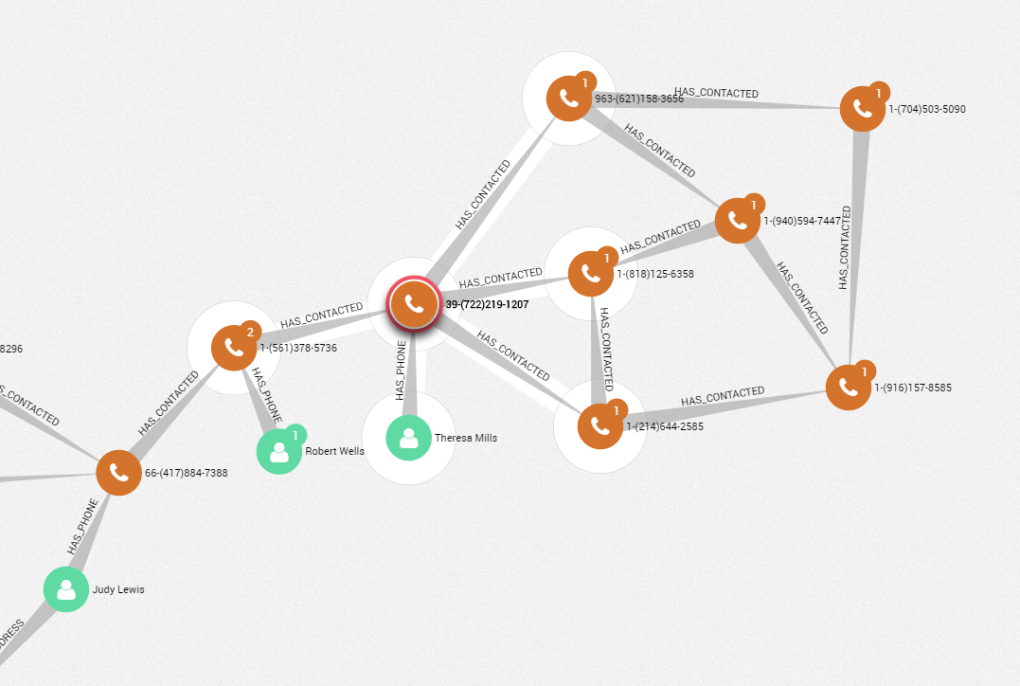
The sub-network around Theresa Mills is very specific. The nodes, all linked together, are phone numbers associated with seven individuals. Such a pattern - a small highly connected group with a unique bridge to other potential suspects – represents a sub-network within the larger network we are investigating.
From a single node, we identified another group, gathering new information about the network. Interactive and scalable tools like Linkurious Enterprise facilitate exploration for experts conducting network intelligence analysis.
The sub-network around Theresa Mills is very specific. The nodes, all linked together, are phone numbers associated to seven individuals. Such pattern -a small highly connected group with a unique bridge to other potential suspects – represents a sub-network within the larger network we are investigating.
From a single node, we went up to another group, gathering new information about the network. Interactive and scalable tools like Linkurious ease the exploration for experts conducting network intelligence analysis.
The graph approach is well suited for the investigation of criminal networks and terrorist groups. Linkurious Enterprise offers intelligence agents a unique entry point to identify hidden insights in complex connected data. Analysts can determine specific patterns to monitor suspicious activities. The visualization interface allows them to navigate between the nodes to identify new key actors through hidden connections.

A spotlight on graph technology directly in your inbox.