When there is power and money at stakes, individuals will resort to cheating to beat the competition. Professional sports have doping and financial markets have insider trading. To understand the role data analysis play in fraud investigation, look no further than the case of former SAC Manager Mathew Martoma convicted in what may be the biggest case of insider trading.
Mathew Martoma was a Portfolio Manager at S.A.C. Capital Advisors, a US hedge fund. S.A.C. Capital Advisors (now known as Point72 Asset Management) is led by Steven Cohen a hedge-fund legend with a net worth estimated to be over $11bn. Years of double-digit growth at S.A.C. have attracted rumors about the methods used by Steve Cohen to attain consistently great returns.
In September 2014, Mathew Martoma was found guilty of taking part in the biggest insider trading transaction in history which netted a profit of $276 million.
Insider trading is “the trading of a public company’s stock or other securities (such as bonds or stock options) by individuals with access to non-public information about the company. In various countries, trading based on insider information is illegal”.
Mathew Martoma speculated on the stocks of 2 companies : Elan and Wyeth. Both these companies were involved in the development of a drug called Bapineuzumab or “Bapi”. They invested hundred of millions of dollars to create Bapi and test its use in the treatment of Alzheimer’s disease. As the destinies of Elan and Wyeth became entangled in the success of Bapi, Mathew Martoma sought out any information he could on the results of the drug trials.
It is normal for investors to seek out information on the companies they trade. That usually means reading publicly available material disclosed by the companies. Mathew Martoma went above and beyond that. He consulted with a Doctor directly involved in the trials and managed to gain his trust. Through this relationship, in July 2008 he learnt before Wyeth and Elan made any public announcement that Bapi was failing as a viable drug. In a few days, Mathew Martoma liquidated his $700M position on the 2 companies and proceeded to short them. His firm S.A.C. netted a $275M profit in the process.
Just 6 years after this success, Mathew Martoma is set to serve a 9-year sentence for insider trading. It is a rare occurrence as insider trading crimes are notoriously hard to prove.
In the cases of insider trading, two or more persons are exchanging information. They usually are both profiting from the crime and thus have a strong incentive to remain silent. The persons involved in the insider trading cases are also well educated. Mathew Martoma for example attended Harvard Law and had a degree in Ethics. He had a good knowledge of what could be used to convict him and he actively protected himself. His mails and text messages to his boss Steven Cohen were briefs as they exchanged sensitive information orally.
To prove that Mathew Martoma was guilty of insider trading, the U.S. Securities and Exchange Commission (or SEC) which is the Federal agency responsible to regulate the securities industry, had to answer one question : how Martoma had access to information about the Bapi trials?
Finding such a connection is a difficult problem. The SEC has access to a lot of data as it can arrange interviews and request phone calls or mails. The problem is how to find a link hidden in all that data?
When S.A.C. Capital Advisors turned the surprise announcement of the failure of Bapi into a big success, the SEC got tipped off. The SEC investigators set out to understand how Steven Cohen and his team could have such an uncanny ability to predict the future. They knew something was off but were unable to prove anything.
It all changed when they studied the phone record of Dr Sid Gilman, a renowned professor involved in the trial of Bapi. Dr Sid Gilman had regular phone conversations with Mathew Martoma. The SEC had found the connection between Martoma and the Bapi trial.
Of course a few phone calls would not be enough to prove anything. A closer investigation revealed that Martoma first contacted Dr Gilman through GLG, a firm providing expert consultants to the finance industry. Martoma slowly built a relationship with Dr Gilman and gained insider information he had access to.
This led to a series of event in the month leading up to a Bapi conference in Chicago, July 2008 :
- Dr Gilman sent an e-mail to Martoma with the subject line “Some news” as he was being appointed by Elan and Wyeth to present the results of the Phase II clinical trials ;
- Following up Dr Gilman’s mail, Martoma scheduled a consultation with Dr Gilman via GLG to discuss “therapies for multiple sclerosis” ;
- Dr Gilman receives the PowerPoint presentation of the latest trial results ;
- Dr Gilman and Martoma spend 105 minutes on the phone the day Dr Gilman received the presentation of the trial results ;
- Martoma travels to Ann Arbor and met with Dr Gilman for an hour before going back to NYC ;
- Martoma calls Cohen at home on a Sunday and they discuss for 20 minutes ;
- Cohen and Martoma initiate a discreet sell-off of all their Elan and Wyeth stocks ;
- In Chicago, Dr Gilman announces in a public conference the disappointing results of the latest trials ;
The SEC mixed testimonies, phone records, emails and computer forensics to recover that chain of events. It was probably a long and very difficult process.
Unwittingly or not, the SEC built a graph. Using multiple data sources it build a network where events, people, dates, locations or companies are linked. It could have done it using graph technologies.
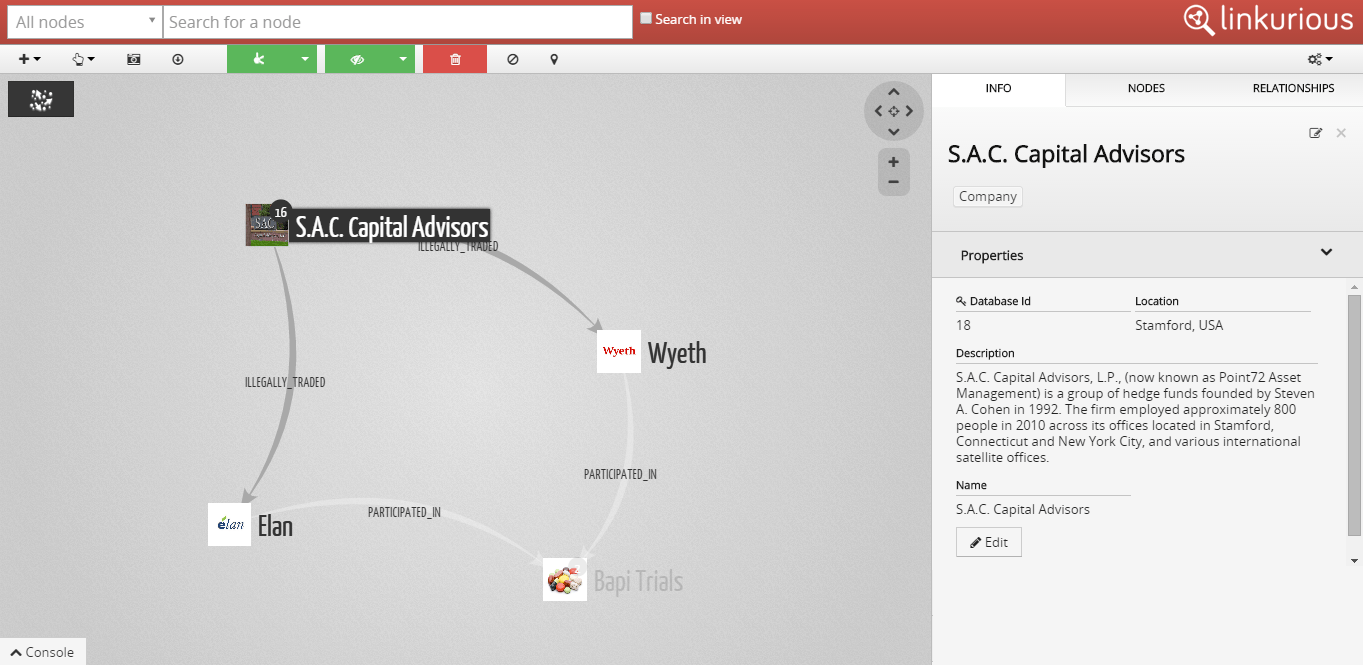
The starting point of the SEC investigation was an intuition. Pharmaceuticals companies Wyeth and Elan were involved in the trial of a new drug called Bapi. S.A.C. Capital Advisors had traded these stocks based on illegally obtained information.

But how to prove the connection between S.A.C. Capital Advisors trading activity and the collection of illegally information. If insider information was used, who obtained it? From whom? To answer these questions, the SEC targeted a few key individuals linked to S.A.C. Capital Advisors and the Bapi trials. The goal was to find a hidden connection.

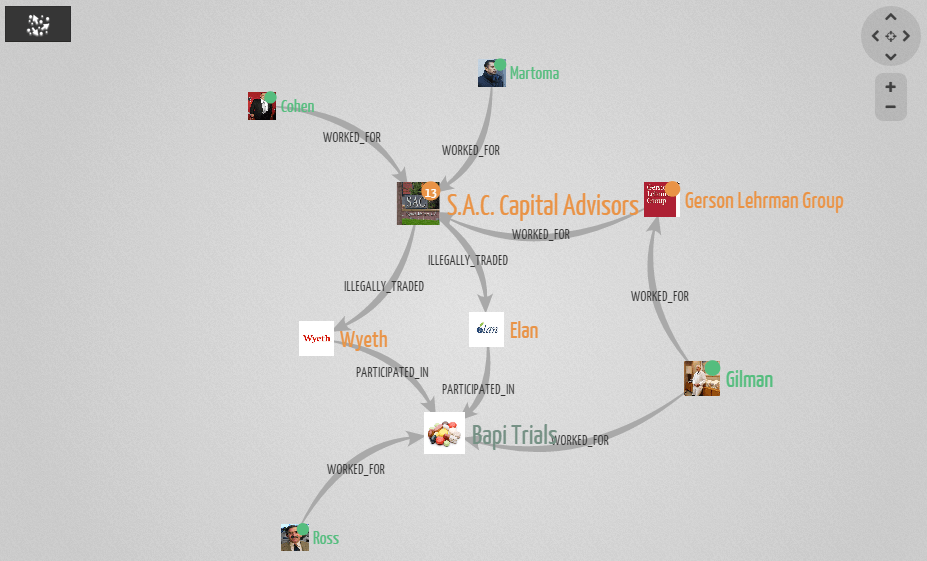
The graph above represents how a few key individuals are connected to the SEC case. Steven Cohen was the CEO of S.A.C. Capital Advisors. He worked here with Mathew Martoma. Dr Ross and Dr Gilman were involved in the Bapi trials, the first as a Clinical Investigator and the latter as a member of the trial’s Safety Monitoring Committee.
What is interesting is that we can see that S.A.C. Capital Advisors is connected to the trials through Gerson Lehrman Group and Dr Gilman. Gerson Lehrman Group is a company that puts field experts in touch with hedge funds. Dr Gilman was working for Gerson Lehrman Group which was working for S.A.C. Capital Advisors. This is actually the source of the leaked information.
To understand how that leaked information was obtained, we need to add to our graph the communications between the protagonists.
The information above is based on what the SEC was able to reconstruct during the course of its investigation. It shows of Mathew Martoma was able to collect insider information from Dr Gilman and how it was used to conduct the biggest insider trade in history.
Insider trading schemes, like most fraud investigations, require sorting through a lot of data to find answers and ensure results (in the form of convictions, money seized, etc). An investigator has to :
- process information coming from various sources (phone calls, testimonies, documents, mails, open-source information, etc) ;
- merge this sources into one unique “big picture” ;
- find key facts hidden in the data ;
- tie the different facts together in one convincing story ;
Graphs technologies can make that job easier :
- a graph is the perfect model to represent the complex connections associated with real world data ;
- graphs technologies are ideal to look for subtle, indirect connections between potential accomplices ;
- graph visualization is a great way to find insights within the data and communicate them ;
With a system based on Linkurious, it is possible for example to store phone call records, open-source information (like Facebook or Twitter), mail exchanges or other relevant data sources within the same data model. Instead of dealing with multiple silos, an investigator can have all the data he needs in one place. A potential perpetrator can have a social media account, a phone or mail address : tying it all together makes it easier to find answers.
To store the data, Linkurious relies on Neo4j, the leading graph database. Neo4j comes with a query language that makes it possible to find precise patterns in large datasets. For example, an investigator might want to know who are all the common contacts between two potential suspects. With Neo4j and Linkurious you can run that search and find an answer in seconds.
Finally, Linkurious makes it easy to explore the data visually. This way an investigator can look into the data and find answers. As he explores the data, he can visualize the connections between the entities he investigate. Graph visualization is also the best way to communicate the result of a complex investigations.
Insider trading investigations are complex. Graph technologies like Linkurious can speed them up by allowing investigators to look for hidden connections within large datasets.
A spotlight on graph technology directly in your inbox.

