Car insurance companies are facing a popular scam called whiplash for cash. It involves fake car accidents and real money. The criminals behind these schemes are well organized. Drivers, passengers, cars : from one accident to another, there is always an element of change. It is a real challenge to identify these criminals and graphs can help with it.
A popular scheme around fraudsters is to use fake car accident to claim money to insurance companies. Properly executed the scheme can pay out handsomely. Everything about these accidents can be fake : fake driver, fake vehicle, fake witnesses. Everything but the money. It is estimated that fraud cost to US insurance companies up to $80 billion per year. That is a lot of money and consumers are paying for it. In the UK for example, each driver pays an additional $144 per year for his insurance because of fraud.
The problem with scheme like whiplash for cash is that it targets the insurance companies weaknesses. Faced with thousands of claims they have a hard time finding suspicious behavior in the data they process. Luckily, like with stolen credit cards or loan fraud, whiplash for cash criminals can be identified with graph technologies.
In order to understand why, we need to see how criminals operate first. It all start with one or more ring leaders. Here is how they usually work :
- the ring leaders recruit drivers, passengers, witnesses : they will be the ones claiming money to insurance companies. These persons may or may not exist as it is possible to create synthetic identities ;
- the ring leaders find vehicles ;
- the ring leaders, the drivers and the passengers organize an accident : this is where it all comes together. The accident may happen or may not happen but everything about it is scripted. Everyone has to agree on a time, a place, a scenario ;
- the passengers, the drivers and the witnesses fill up insurance paperwork : in order to claim money, they have to fill an accident report and various forms. At this stage, the fraudsters may use a doctor as an accomplice to justify the claims ;
- the company processes the claims : it may or may not investigate the claim. In any case, the preparation of the fraudsters shelter them from being easily unmasked ;
They money the criminals can make out of an accident depends on a few variables. The damages received by the car and the injuries sustained by the “victims”. Savvy criminals know better than to claim very high amount. The general idea is to fly below the radar and avoid scrutiny from insurance investigators. This means limiting the damages made to the car and the injuries. According to Gorka Sadowski from Akalak, it is possible in one accident to claim $20k per person in injury and $5k per car. Assuming 6 persons per car, that’s $250k. That is quite a lot of money, especially if the risks involved are low.
Insurance companies face a few challenges when they want to fight back against whiplash for cash schemes. At the individual level, it is hard to spot a fake car accident. On paper it will look legitimate. Even if the investigators have a doubt, they will be hard pressed to build a solid case. Fraudsters work with lawyers and doctors who help strengthen their operation. They choose injuries that are hard to assess and disprove. In the end, the insurance company has a hard decision to make : taking legal action and fighting in court, with a chance of losing, or paying out a small sum.
What’s even worse, is that the scammers can repeat their scheme again and again without being caught. From one accident to the next, they change a name, drivers become passengers, vehicles are recycled. The insurance companies have a very hard time connecting all of these entities across multiple accidents. And if they do detect the scheme, it takes months and months to trace back every connection and assess the full impact of the scheme. No wonder that whiplash for cash is so popular among fraudsters!
Fortunately, all these issues arise from a problem that can be fixed : how to identify and analyse connections in a large dataset? The answer? Graphs!
We are going to see that we can model the data the insurance company has about its accidents as a graph. In order to do that we’ll use the work of Gorka Sadowski from Akalak and Philip Rathle from Neo Technology. I encourage you to watch their great presentation on fraud detection in real time with graphs.
As an insurance company we have data about insurance claims. In the insurance claims we find :
- people ;
- car ;
- accidents ;
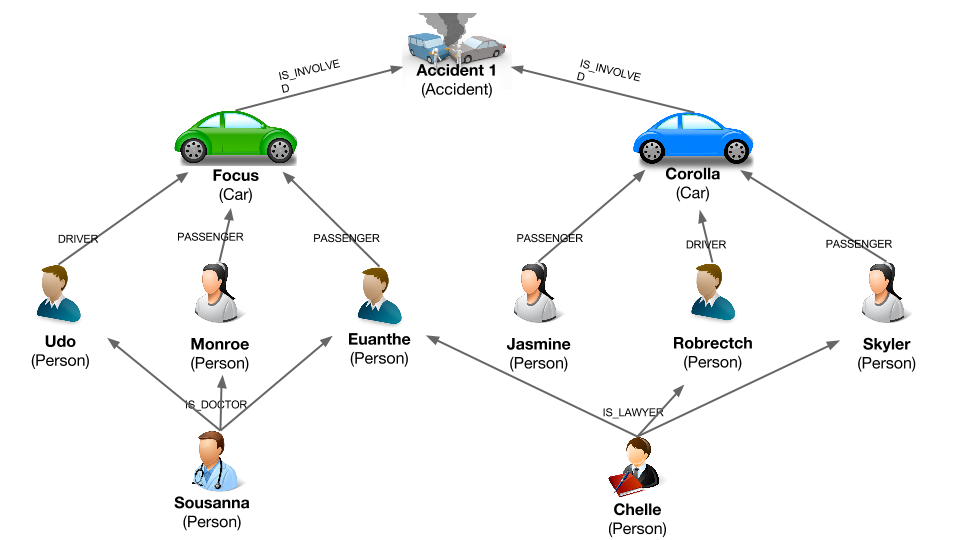
People can drive or be passengers of cars. Cars can be involved in accidents. Lawyers and doctors can be linked to people they work for. It is a fairly simple graph. Here is a picture that sum it up :

What is interesting about this schema is that it expresses the relationships between the different entities involved in our fraud scenario. As we have seen, these connections are key to identify fraudsters.
I have prepared a small dataset based on the schema above and the presentation of Gorka Sadowski and Philip Rathle. That dataset has been loaded in Neo4j, the leading graph database. You can download it here.
Now that we have a graph schema that represents the data insurance companies have, we can start hunting for criminals. In order to do that, we’ll use Cypher. It is a query language specific to Neo4j and made for graphs.
Let’s start with a simple example. As a fraud investigator, we want to get all the entities that are linked to a particular accident. Here is how to do it :
MATCH (accident)<-[]-(cars)<-[r]-people
WHERE accident.location = ‘New Jersey’
RETURN DISTINCT people.first_name as first_name, type(r) as relationship, accident.location as location, cars.model
The results can be viewed as a simple table :
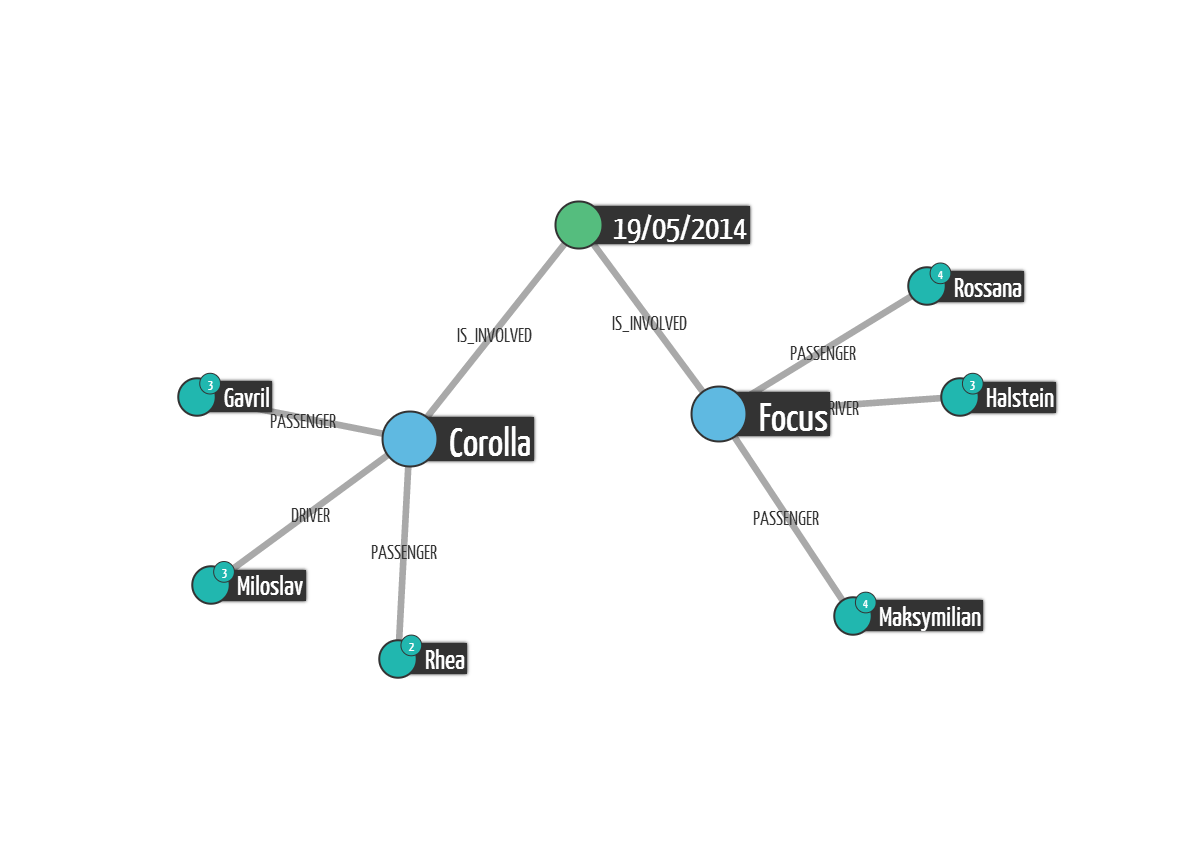
That table is a great way to understand all the entities involved in the accident. It does not necessarily tell us how they are linked together but for that we can turn to Linkurious or to another graph visualization solution :

We can see who are the persons involved in a single accident. But that information alone is not sufficient to identify a fraud. The question we need to ask is are the cars and people of the first accident involved in other accidents. Here is how to ask the question :
MATCH (accident)<-[]-(cars)<-[]-people-[]->(othercars)-[]->(otheraccidents:Accident)
WHERE accident.location = ‘New Jersey’
RETURN DISTINCT otheraccidents.location as location, otheraccidents.date as date
We get two results : one accident in Florida on May the 23th and another accident in Florida on May the 27th. Suddenly, this simple accident is looking for suspicious as its participants are also connected to two other accidents. It’s time to investigate further.
A traditional database would be able to answer that question somewhat quickly. But what we are really interested in is not just direct connections but also the connections of the direct connections. That kind of search is harder to perform with a traditional relational database. Graph databases on the other hand are optimized for these queries.
We started with one accidents and found the cars and people involved in it. We checked to see if they were involved in other accidents. They were and that is suspect. What we want to know now is to uncover the whole ring of fraudsters, all the people and cars involved in the fraud. That means following a trail : we start from one accident, look for a connection with other accidents, look again for connections with other accident, etc. That kind of query is taxing for a relational database : it means performing joins between table. It is not easy to write and takes time to execute.
With a graph database, the same query is very easy :
MATCH (accident)<-[*]-(potentialfraudtser:Person)WHERE accident.location = ‘New Jersey’
RETURN DISTINCT potentialfraudtser.first_name as first_name, potentialfraudtser.last_name as last_name
The result is the list of all the people we could suspect to be a part of the whiplash for cash fraud ring :
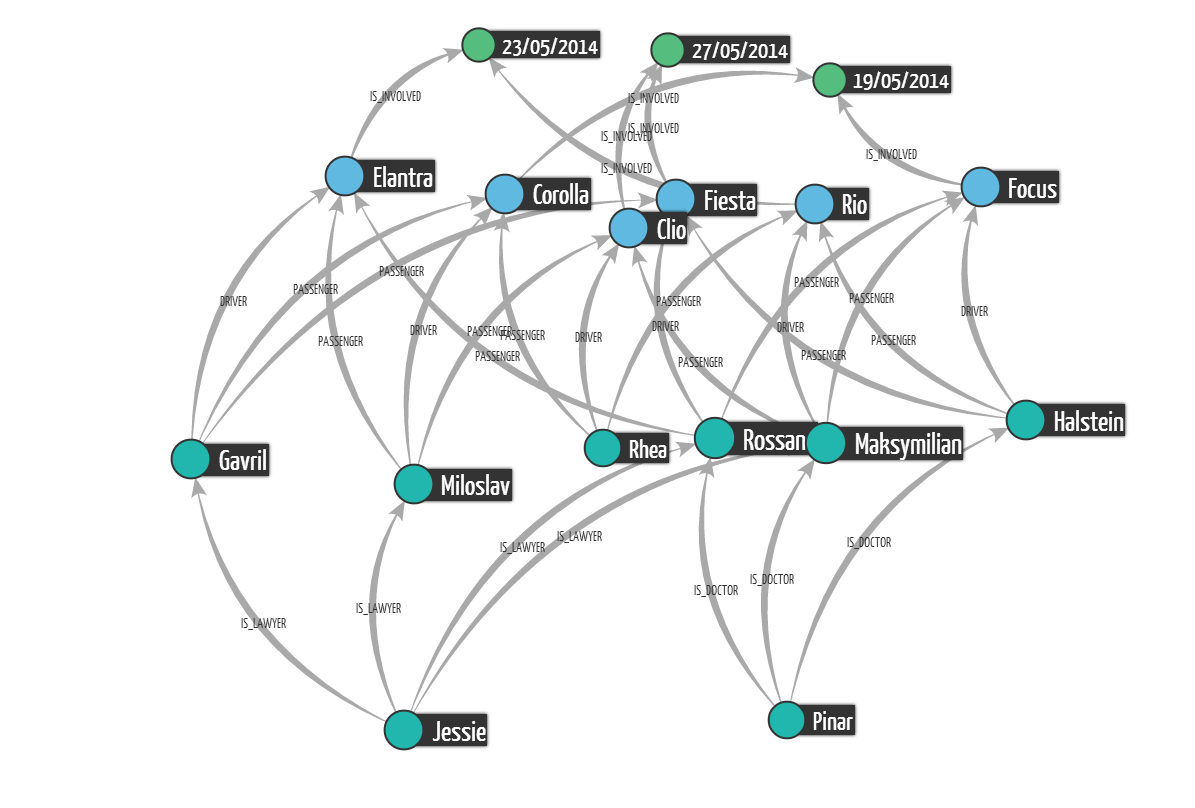
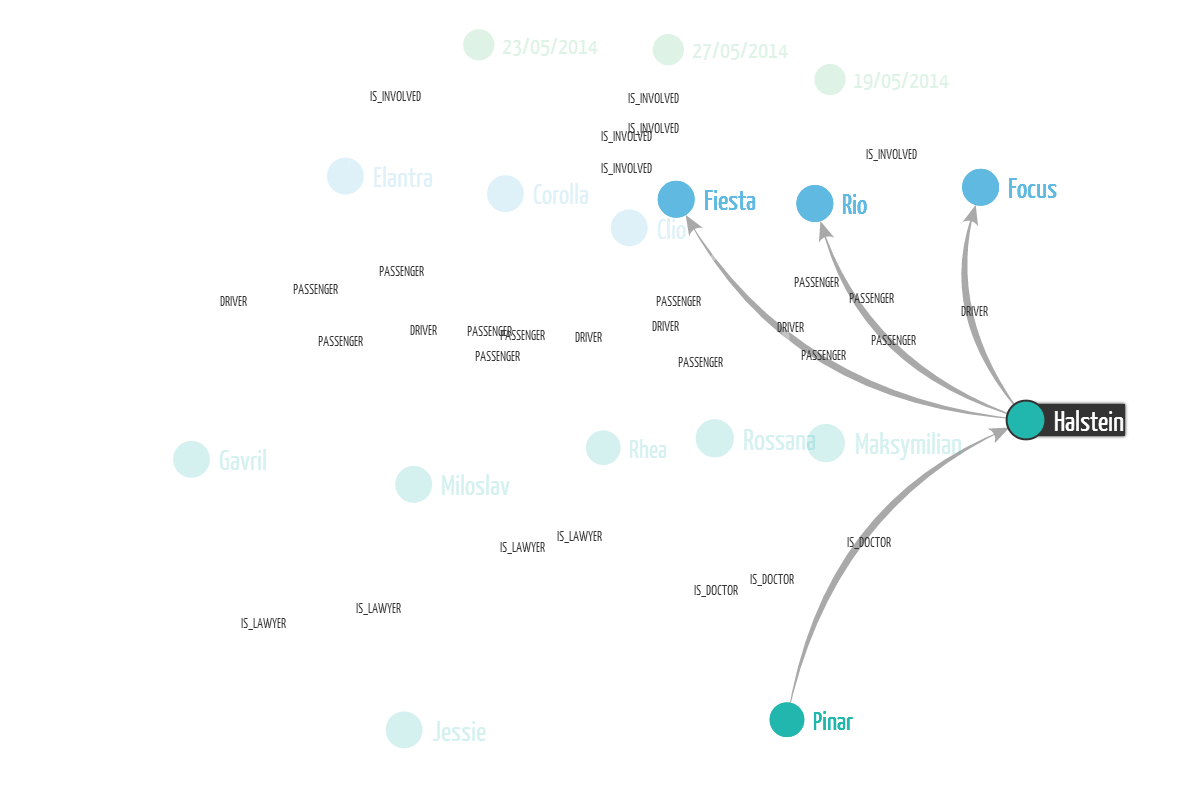
We can once again visualize the results. This time we have a complete picture of the fraud ring. Click to zoom on the pictures.


Graph technologies allow to ask sophisticated questions about the connections in your data. But sometimes it is not enough to be able to investigate the data ex ante. The damage may have already been done. What is better is detecting suspicious patterns in real-time. But how to do so?
Cypher, the same language we have used to search data, can also be used for pattern matching. We model what we consider suspicious and Cypher can help us detect it. In our use case, there are various patterns we could use. For example, we could look for chains of people involved in different accidents. If someone is involved in an accident with someone who is involved in an accident with someone who is involved in an accident…we might be looking at a fraud ring. It is quite rare to have 3 people involved in 3 accidents, especially if one of the “accidentee” is linked with the other 2 victims.
So, how do we look for this? Here is a Cypher query that should help us :
MATCH (person1:Person)-[*..2]->(accident1:Accident)<-[*..2]-(person2:Person)-[*..2]->(accident2:Accident)<-[*..2]-(person3:Person)-[*..2]->(accident3:Accident)
RETURN DISTINCT person1, person2, person3
That query should warn us when a group of fraudsters strike. To implement it, we’d simply have to trigger the query at key moments of the customer lifecycle : when a new customer subscribe to a policy, when a new car is registered by a customer, when an accident happen. Graph analytics are great for pattern matching in connected data : this unique ability could allow insurance company to identify fraudsters faster and fight back efficiently.
To complement any fraud detection system, it is important to use data analysis tools like Linkurious. These tools are important because they empower fraud analysts : faced with an alert, they can investigate it. Based on this they can take an informed decision. They can confidently decide between doing nothing or launching a full-on investigation with legal action.
Fraud detection is often about finding unsuspected connections people seemingly unrelated persons. Graphs are great for this, it is no wonder then that they can be used to fight againt whiplash for cash scams.
A spotlight on graph technology directly in your inbox.

