Graph analytics, an emerging branch of data analytics, helps organizations across industries gain a deeper understanding of their connected data. To analyze data as a graph, information is usually stored in a graph database. A graph data model enables users not only to analyze individual data points, or nodes, but also to understand how those nodes are connected.
By treating the connections within data as first-class citizens, graph analytics quickly surfaces patterns and relationships in even the most complex datasets through graph algorithms. Graph can also be combined with other analytical techniques such as machine learning. It offers an intuitive way to model data, since graphs mimic real-world structures through interconnected nodes and edges.
So what can you do with graph analytics? This technology has many applications across industries, with new ones emerging all the time. Here are some examples of common graph analytics use cases to get you started.
With technological innovations on their side, clever fraudsters often stay one step ahead of fraud-fighters as they constantly find new tactics to evade detection. Fraud investigators have large datasets at their disposal, but without the right tools, it can be difficult to spot illegal activity within multiple, siloed data sources. Most anti-fraud applications are able to connect simple data points together to detect suspicious behaviors: an IP address to a user, transaction activities to a place of residence, or a loan request history to a customer.
Graph technology brings these data sources together, making it fast and easy to see patterns that might indicate fraudulent behavior. Graph analytics can help surface many types of fraud:
- Procurement fraud: Graph analytics can surface hidden connections between employees and vendors that may be indicative of suspicious behavior.
- Insurance fraud: Graph analytics can help identify if within an insurance company’s client database multiple people are interconnected across vehicles, individuals, repair shops or claims. The larger the network, the more likely that fraud is going on.
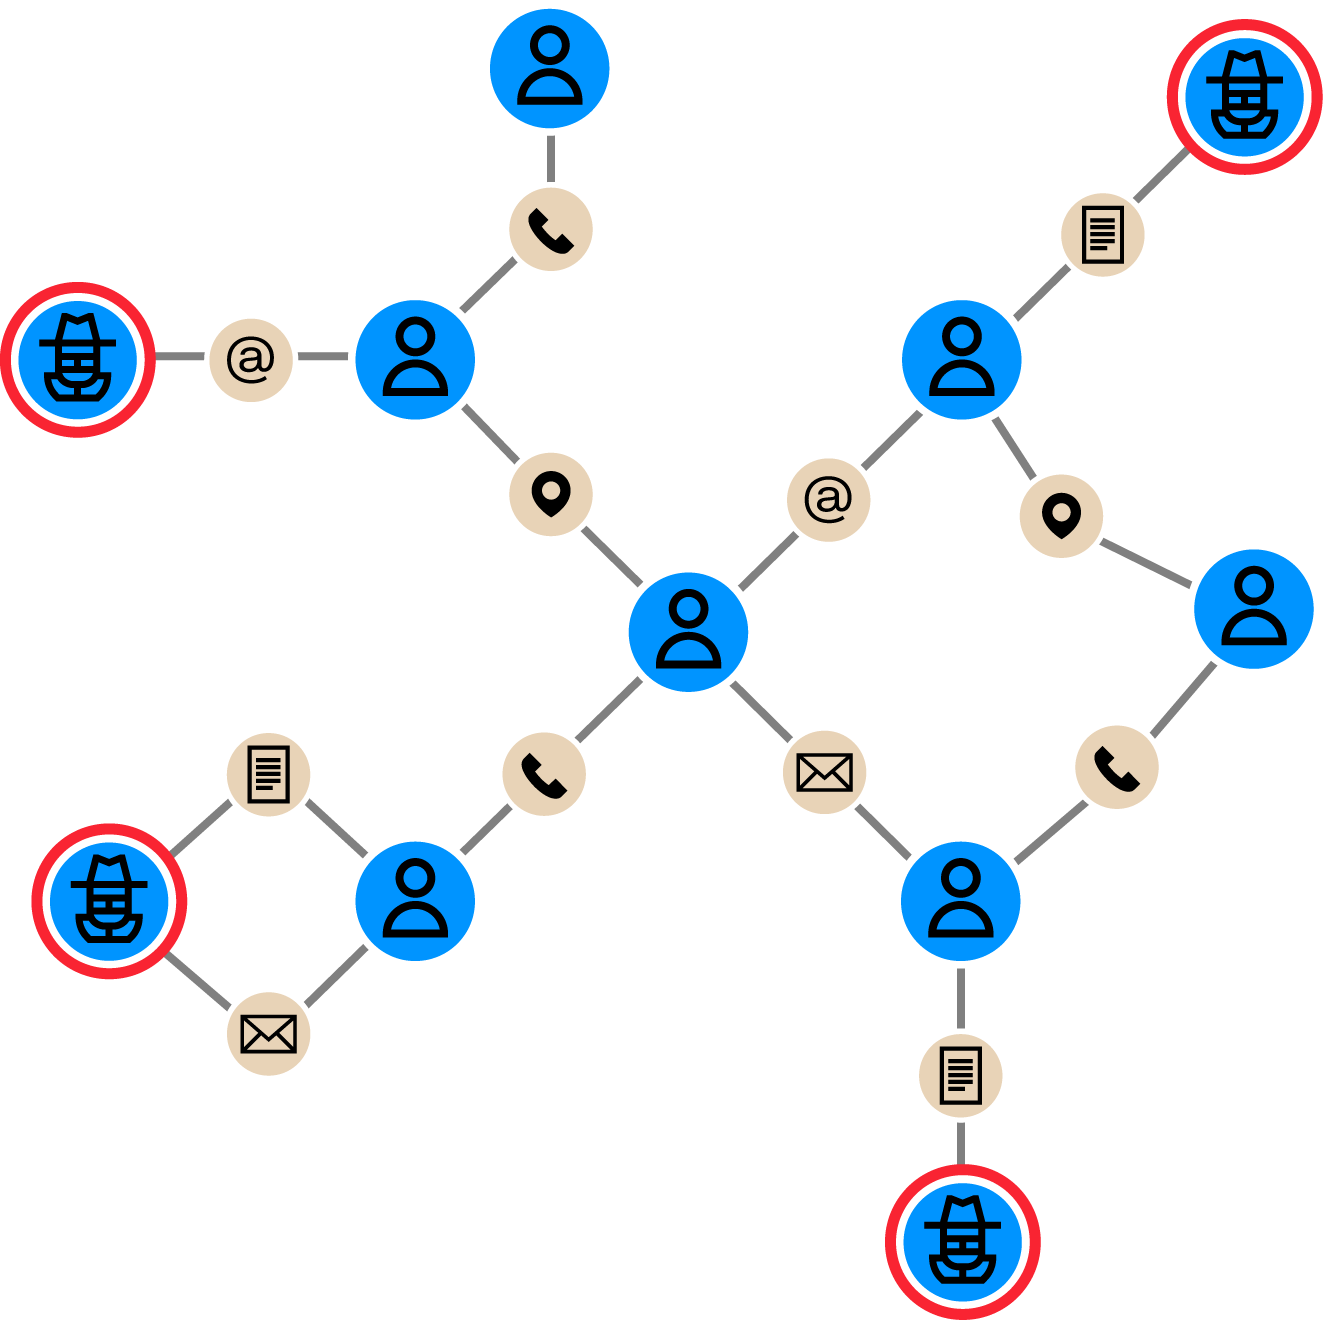
- Synthetic identity fraud: Investigators and analysts can quickly see if there are pieces of data shared by multiple applicants or account members - such as an address, phone number, or date of birth - which may indicate a ring of fraudsters operating with synthetic identities.
Money launderers go to great lengths to cover their wrongdoing, making it especially difficult to detect suspicious activity. Complying with sanctions and beneficial ownership rules can also be time-consuming and turn up huge numbers of false positives when using traditional data analytics methods.
Graph analytics, or link analysis, can help banks and financial institutions quickly identify suspicious money transfers or relationships between seemingly normal customers and accounts and suspicious ones. Graph can surface many types of patterns that AML analysts might want to investigate further:
- Money mules: Graph analytics lets you quickly see where money has been transferred and in what amounts, surfacing suspicious patterns that merit further attention.
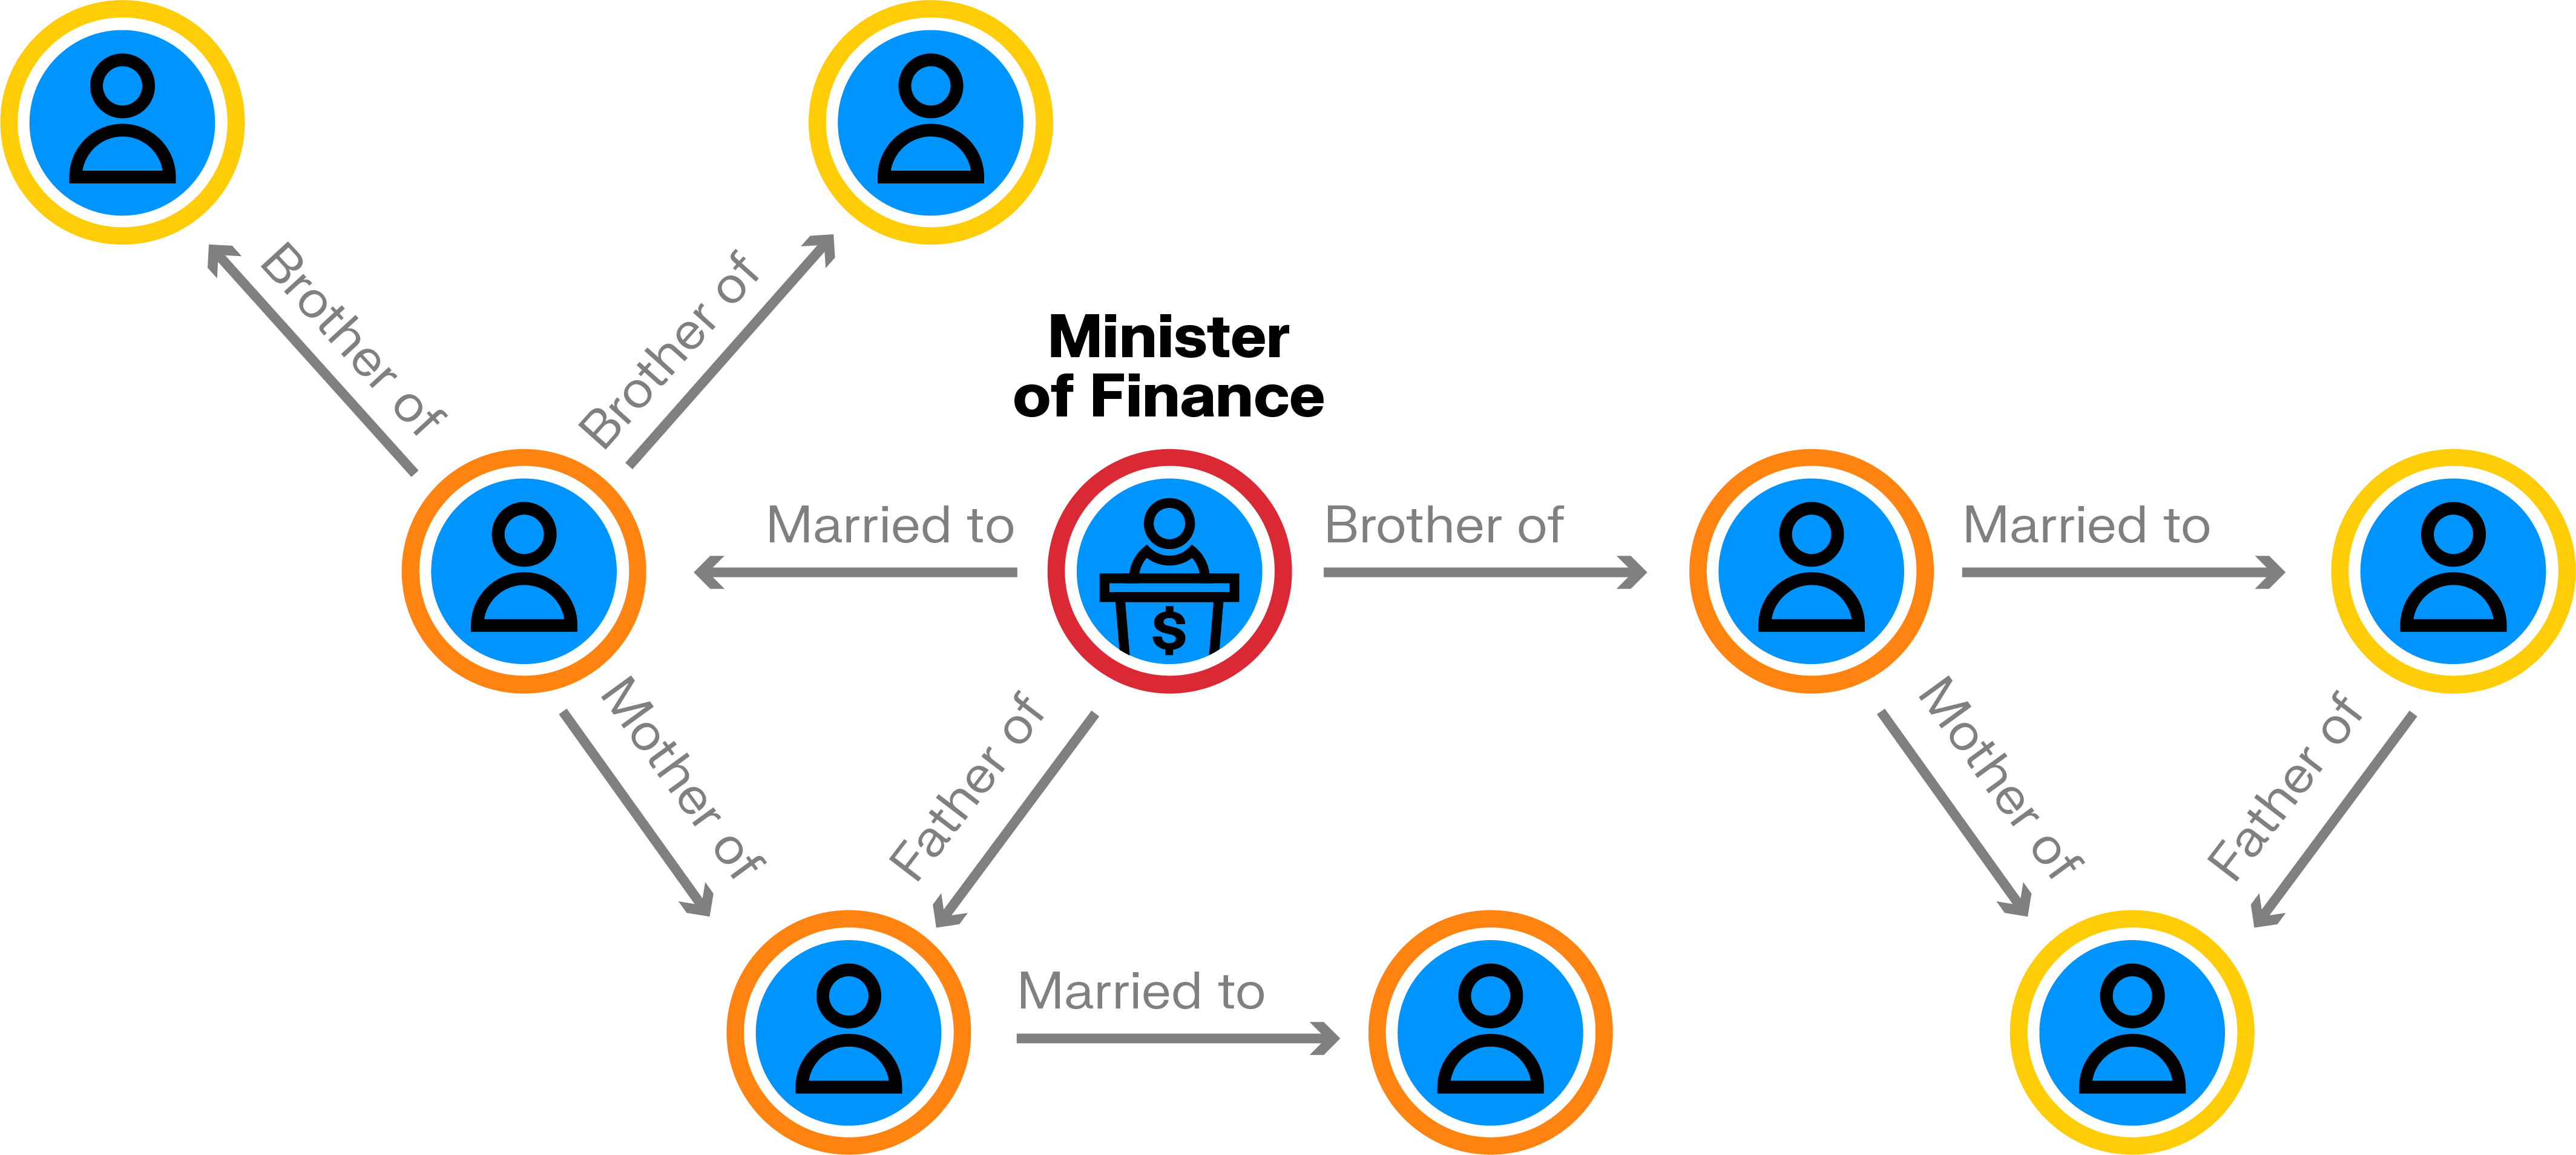
- UBO identification: With graph analytics you can write a single query to turn up an entire ownership structure that lets you visualize odd patterns or people right away.
- Sanctions screening: Graph lets you identify hidden relationships across clients, companies, and metadata, like shared addresses, emails, IPs, or co-ownership. It flags not only direct connections, but layered associations that may point to hidden risk.
- Identifying Politically Exposed Persons (PEPs): Because graph is all about relationships, it provides a fast way to visualize the entire network of relationships around an individual. This lets financial institutions see if a new or existing customer is connected to a PEP and requires additional due diligence.
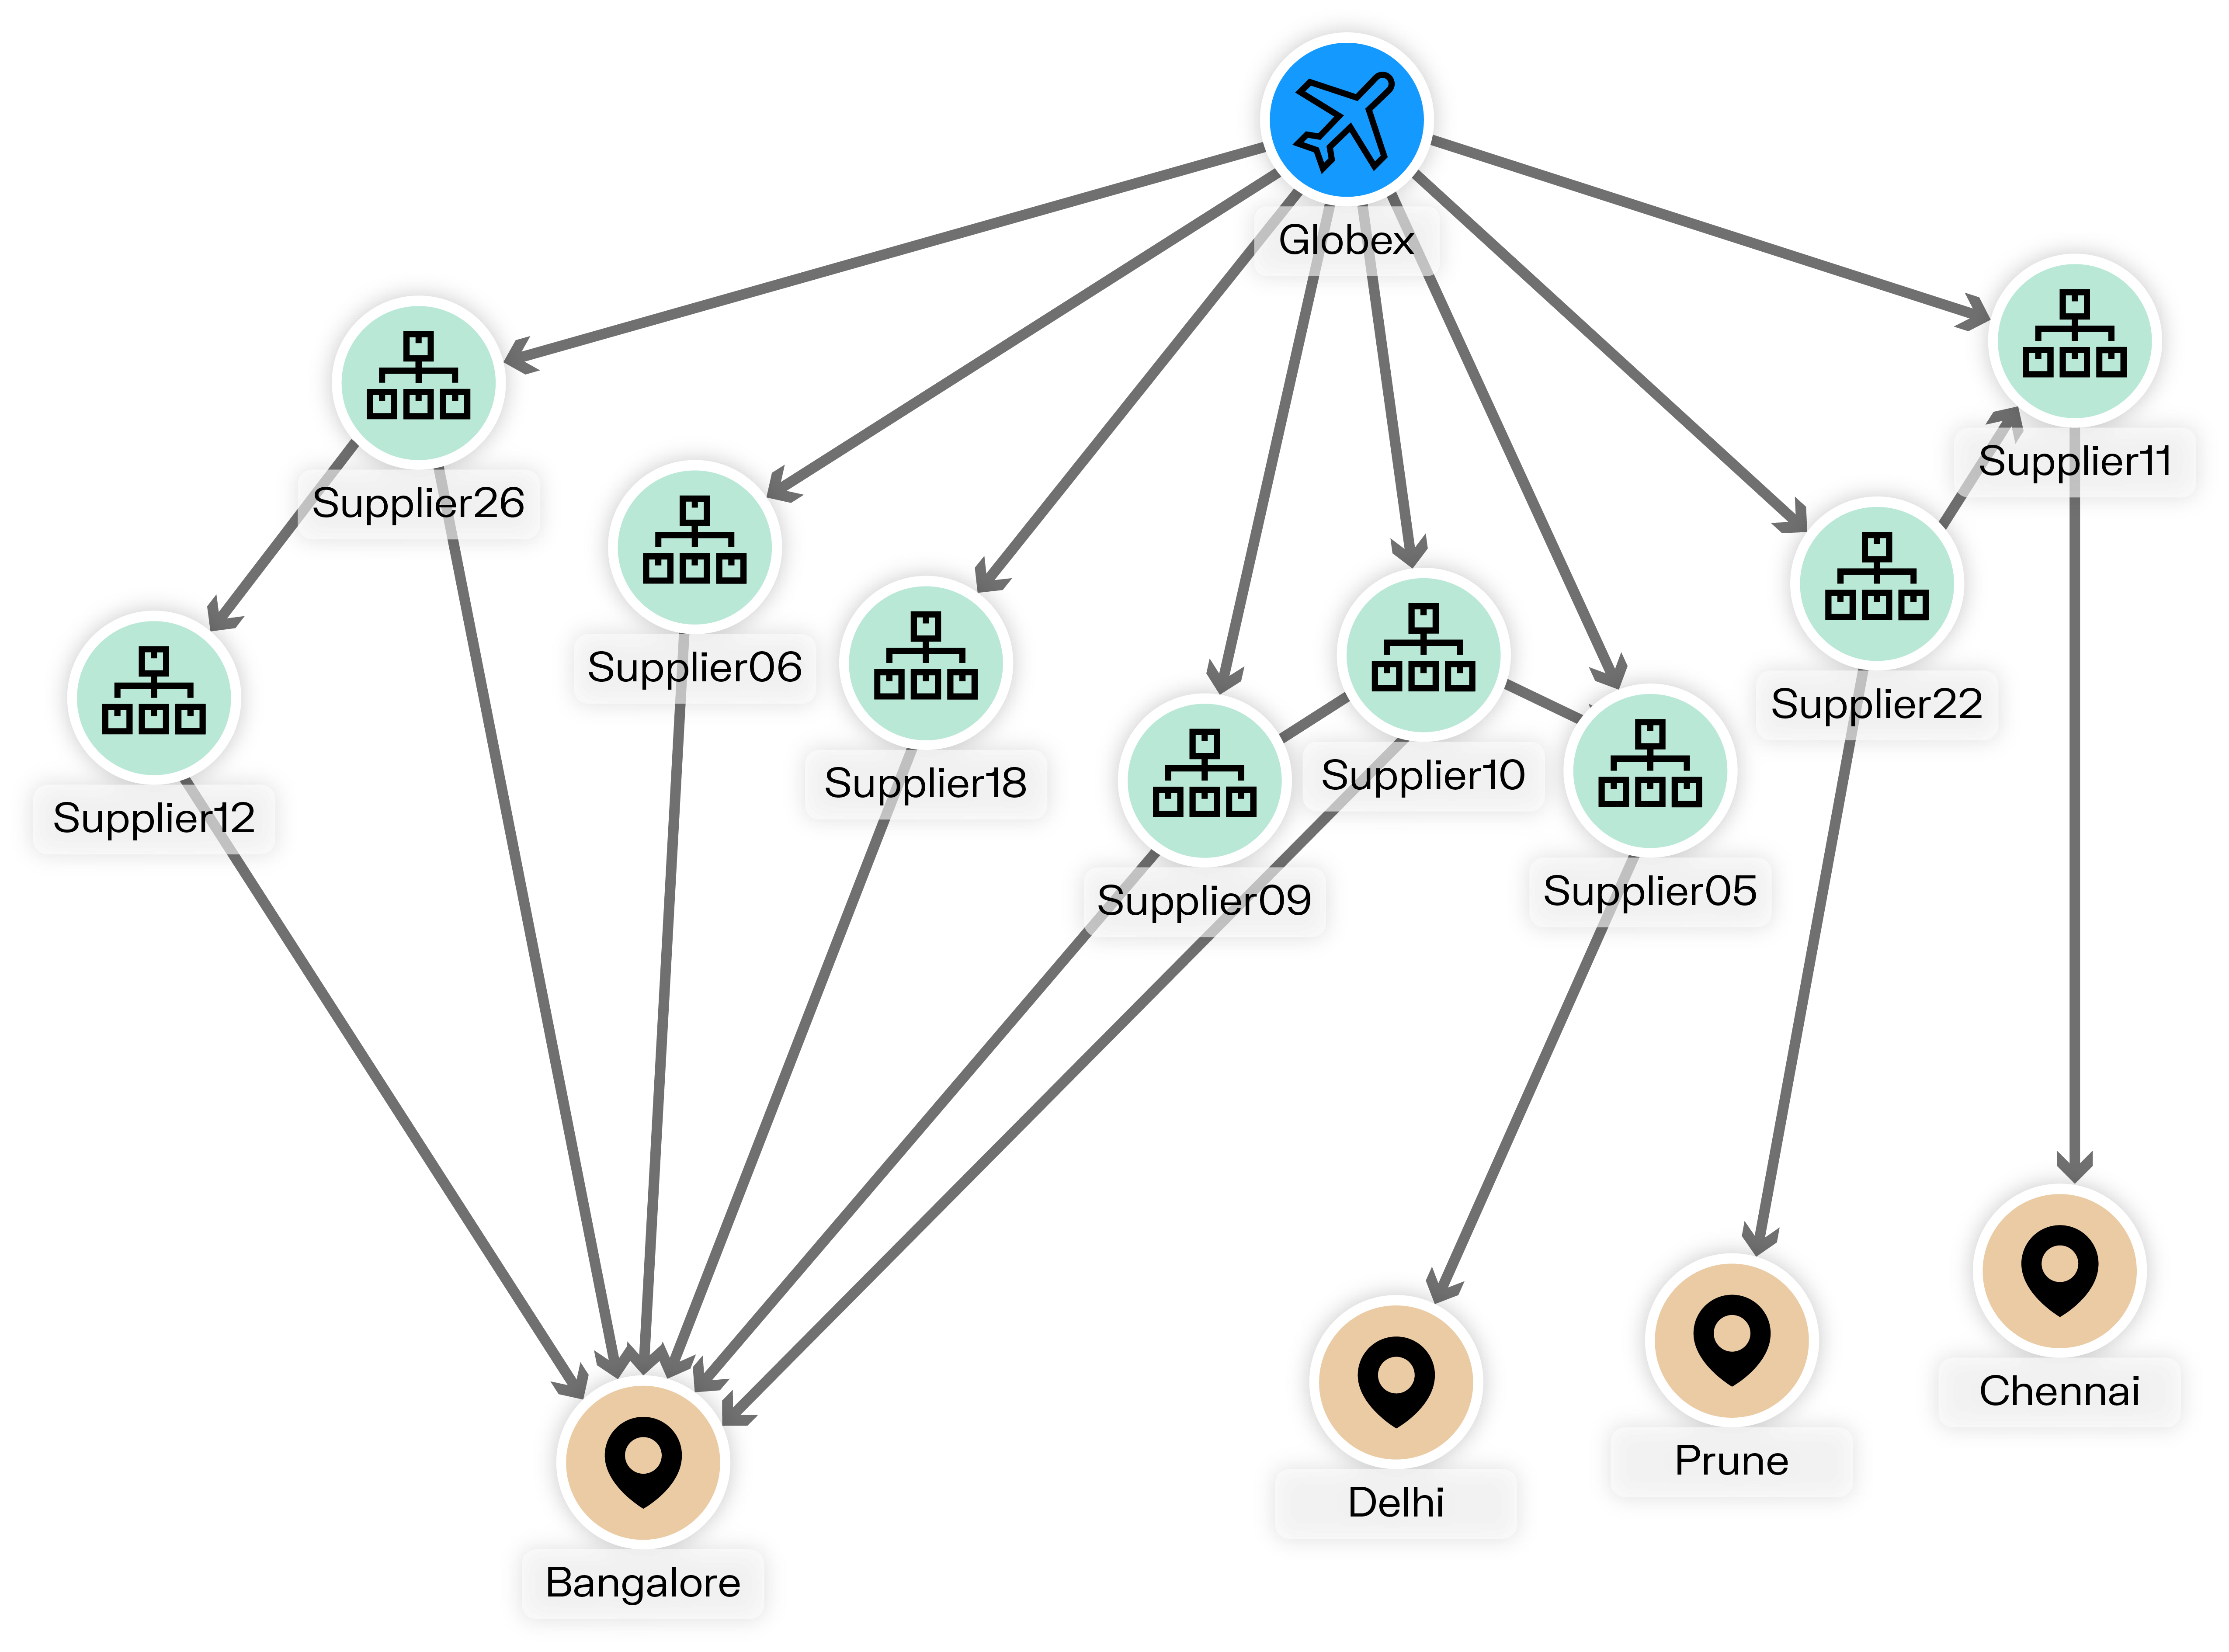
International supply chains have grown highly complex, full of connections and dependencies. Building a single product may require components from multiple different countries and suppliers, and several production steps across locations.
Graph analytics provides companies with a clear view of data and operations. It’s a natural way of modeling the complex, interconnected networks that represent modern day supply chains. It also provides an intuitive way to pinpoint key information and perform important analyses:
- Visibility and traceability: Graph lets you track products and components through the supply chain to provide full traceability and ensure compliance with regulations.
- Risk management: Graph can analyze dependencies between nodes, points of failure, and bottlenecks to identify specific risks—and mitigate them before they become a costly problem.
- Demand forecasting: Graphs can be used to analyze and predict demand patterns by considering various factors, such as past sales data, seasonality, and external events (natural disasters, pandemics).
Most governments maintain intelligence operations to support law enforcement, national security, or the military. Intelligence agencies collect and analyze data from various sources to find evidence of things like terrorist networks, for example. But legacy tools and traditional analysis techniques may struggle to handle the volume and interconnectedness of modern-day intelligence data.
Graph analytics allows you to quickly analyze the connections between people, emails, transactions, or phone records to facilitate intelligence insights within a unified graphical representation. Graphs have many applications within the domain of intelligence and security, for example:
- Analyze terrorist threats: Graph analysis lets you analyze both past patterns of terrorist activity and current interactions between suspicious individuals to predict and analyze future threats.
- Defense operations: By modeling communications data as a graph, analysts can gather real-time insights for better decision-making and adaptability in vital defense situations.
- Uncovering criminal networks: Law enforcement agencies can integrate data from various sources into a graph, and use analytics to identify key players to prioritize cases and inform decision-making by allowing crime fighters to identify key patterns and trends.
IT operations management has become an increasingly important and complex field with our expanding reliance on computer systems, networks, and the growth of the Internet of Things. Graph analytics thrives on complexity and can be used to understand dependencies within even the most extensive IT infrastructure. It provides an efficient way to analyze key information.
- Optimizing data security: Graph technology lets organizations model and analyze user behavior across their data ecosystem and raise alerts when deviations occur, indicating a possible security breach or unauthorized data access.
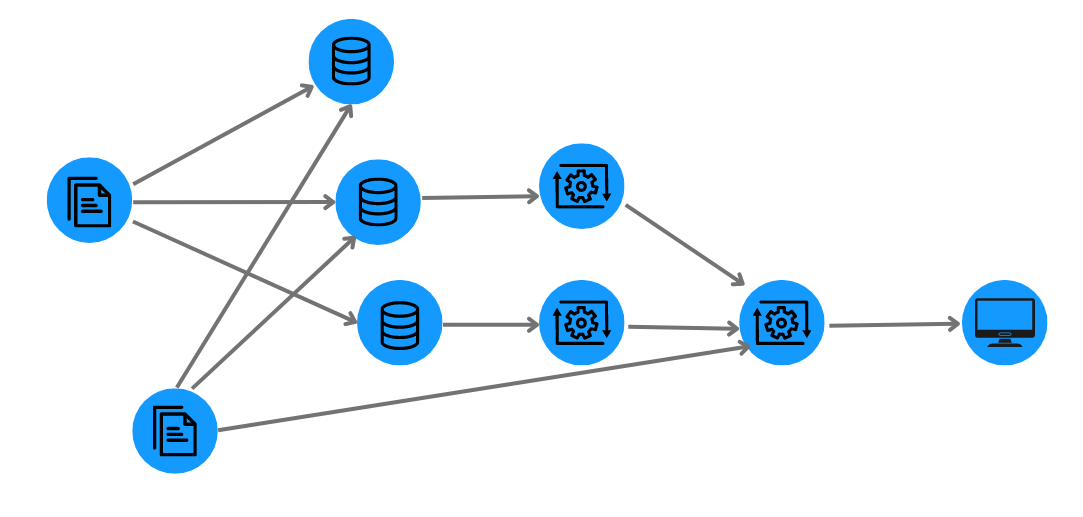
- Facilitating data lineage: Graph creates an intuitive map of how data moves through an organization, making it easier to identify potential bottlenecks, duplication, or inconsistencies in the data flow.
- Regulatory compliance: Organizations may need to comply with regulations like General Data Protection Regulation (GDPR) in the EU, or Health Insurance Portability and Accountability Act (HIPAA). Graph creates a transparent and easy to understand record of how data has been handled and who has access to it.
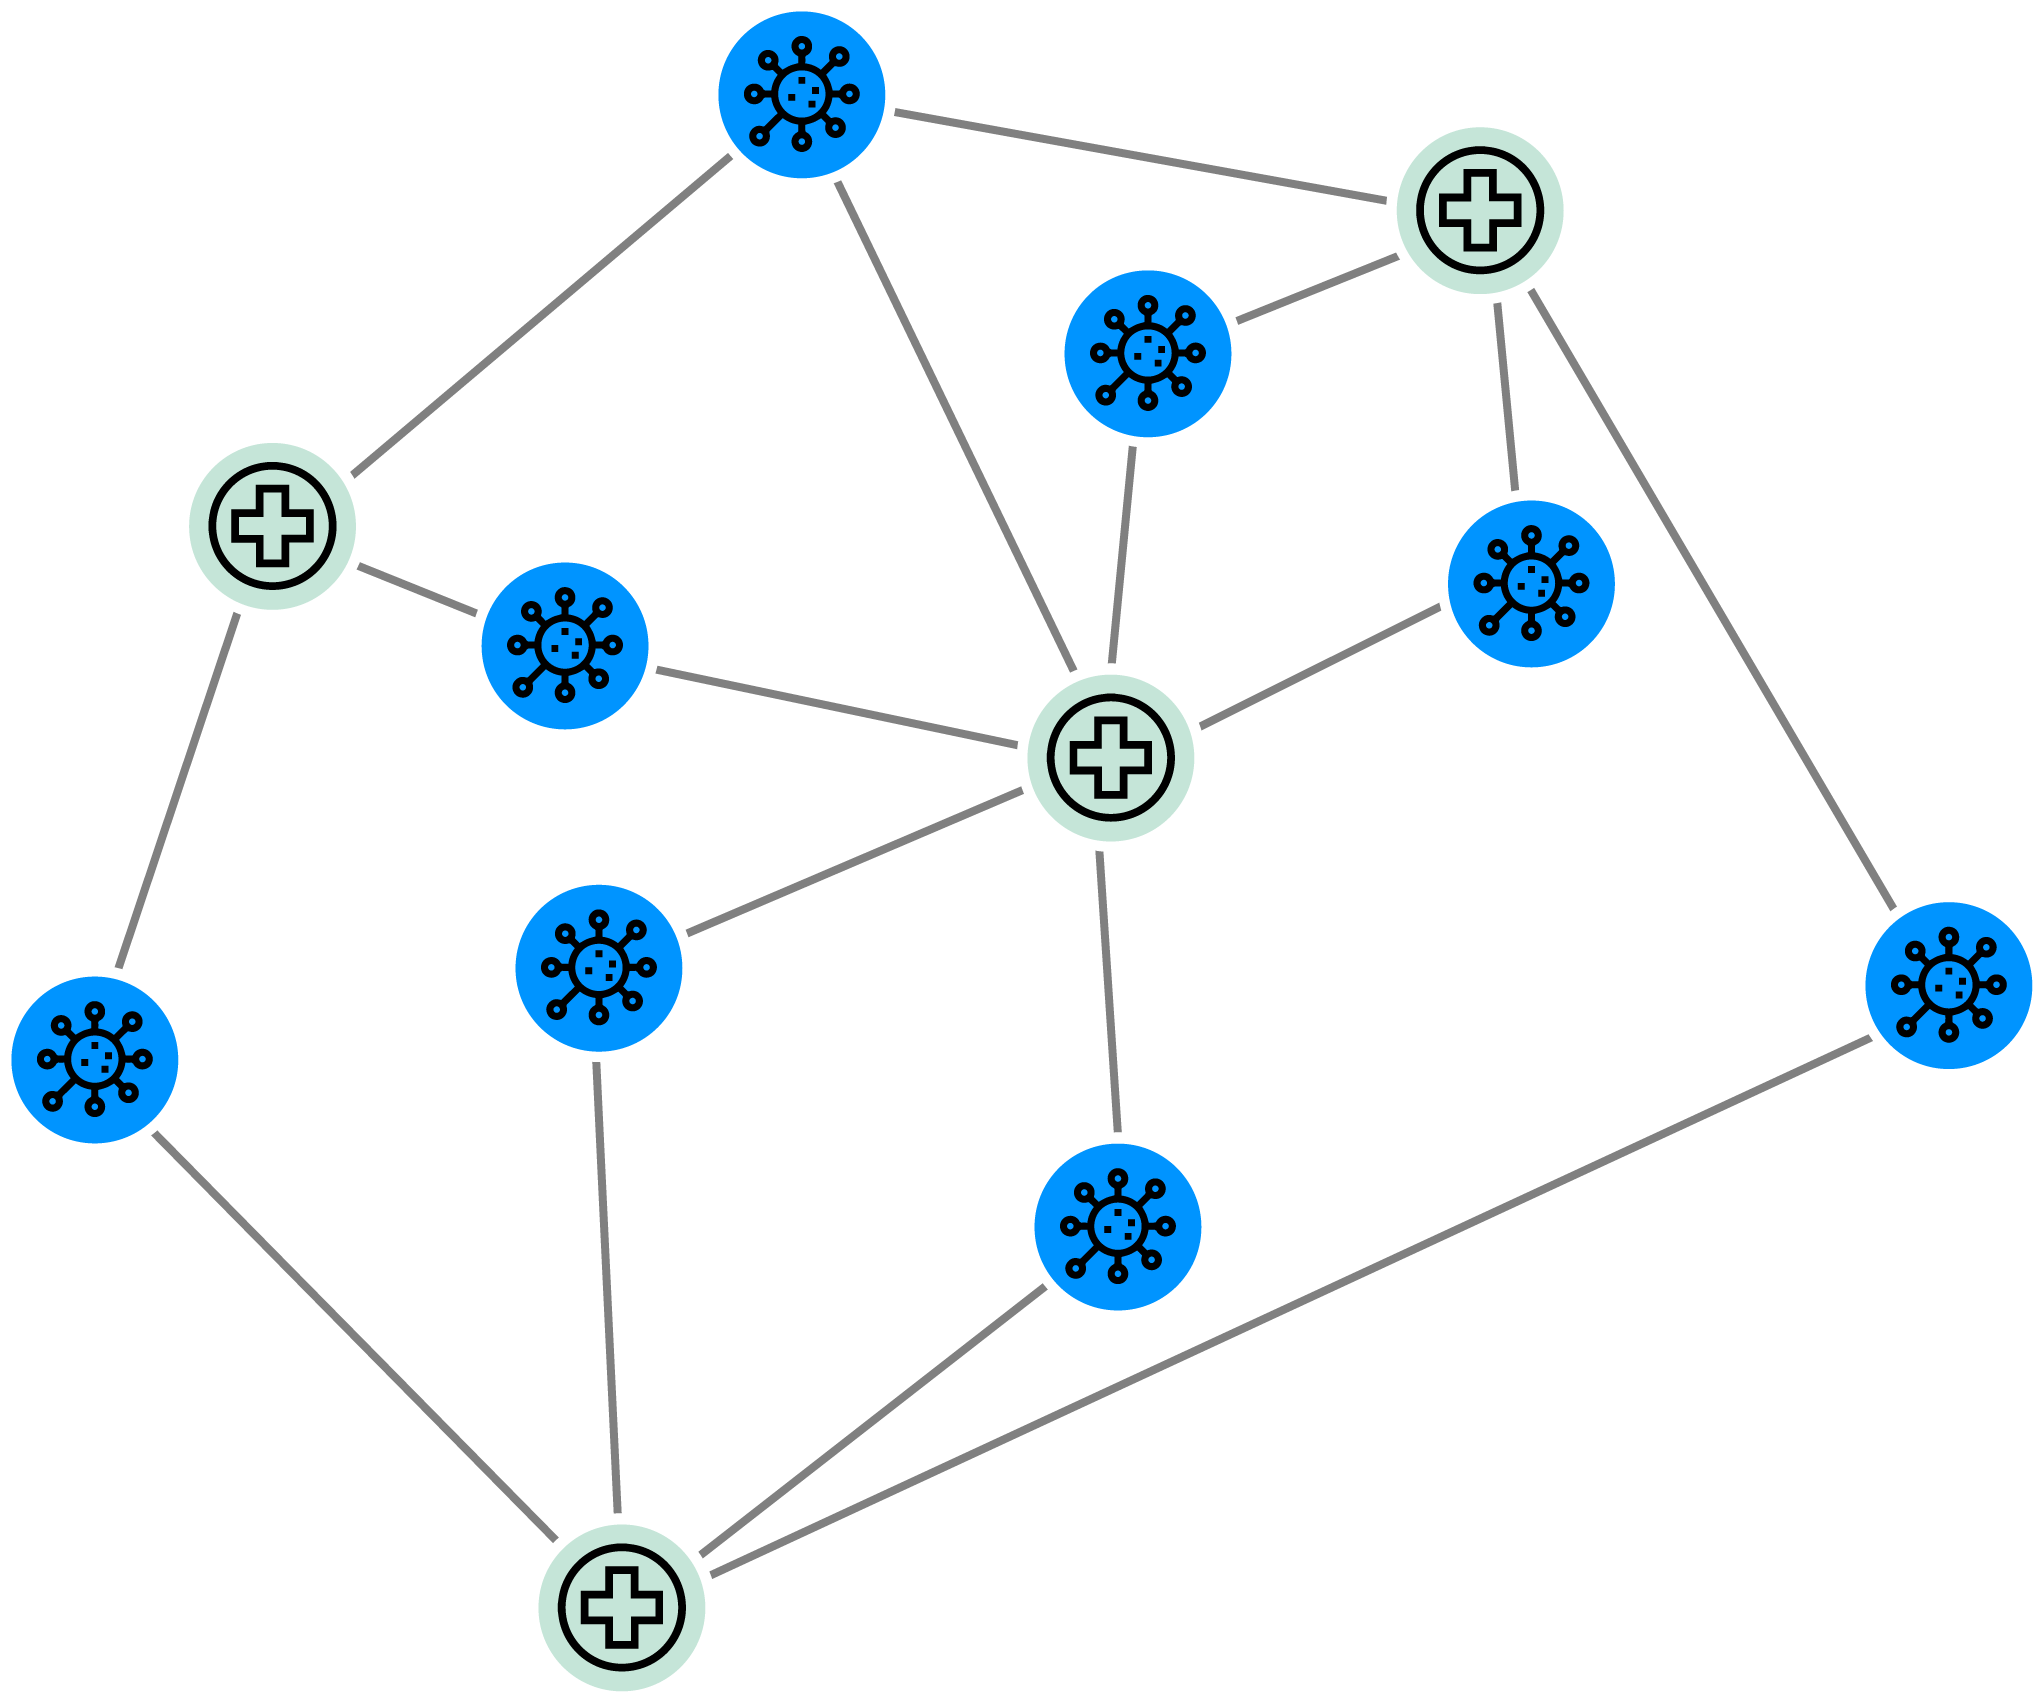
Medical and life science research is frequently about connections and dependencies. Working with very large datasets can make it difficult to identify the insights scientists need to advance their research.
Graph analytics has many applications in medical research where large sets of interconnected data come into play.
- Drug discovery: A graph can combine different types of data related to drugs and disease, such as data on biochemical interactions, active ingredients, etc. to identify potential new applications for existing drugs.
- Tracking disease spread: A graph containing patient data, travel histories, etc. can help public health authorities track the spread of a disease.
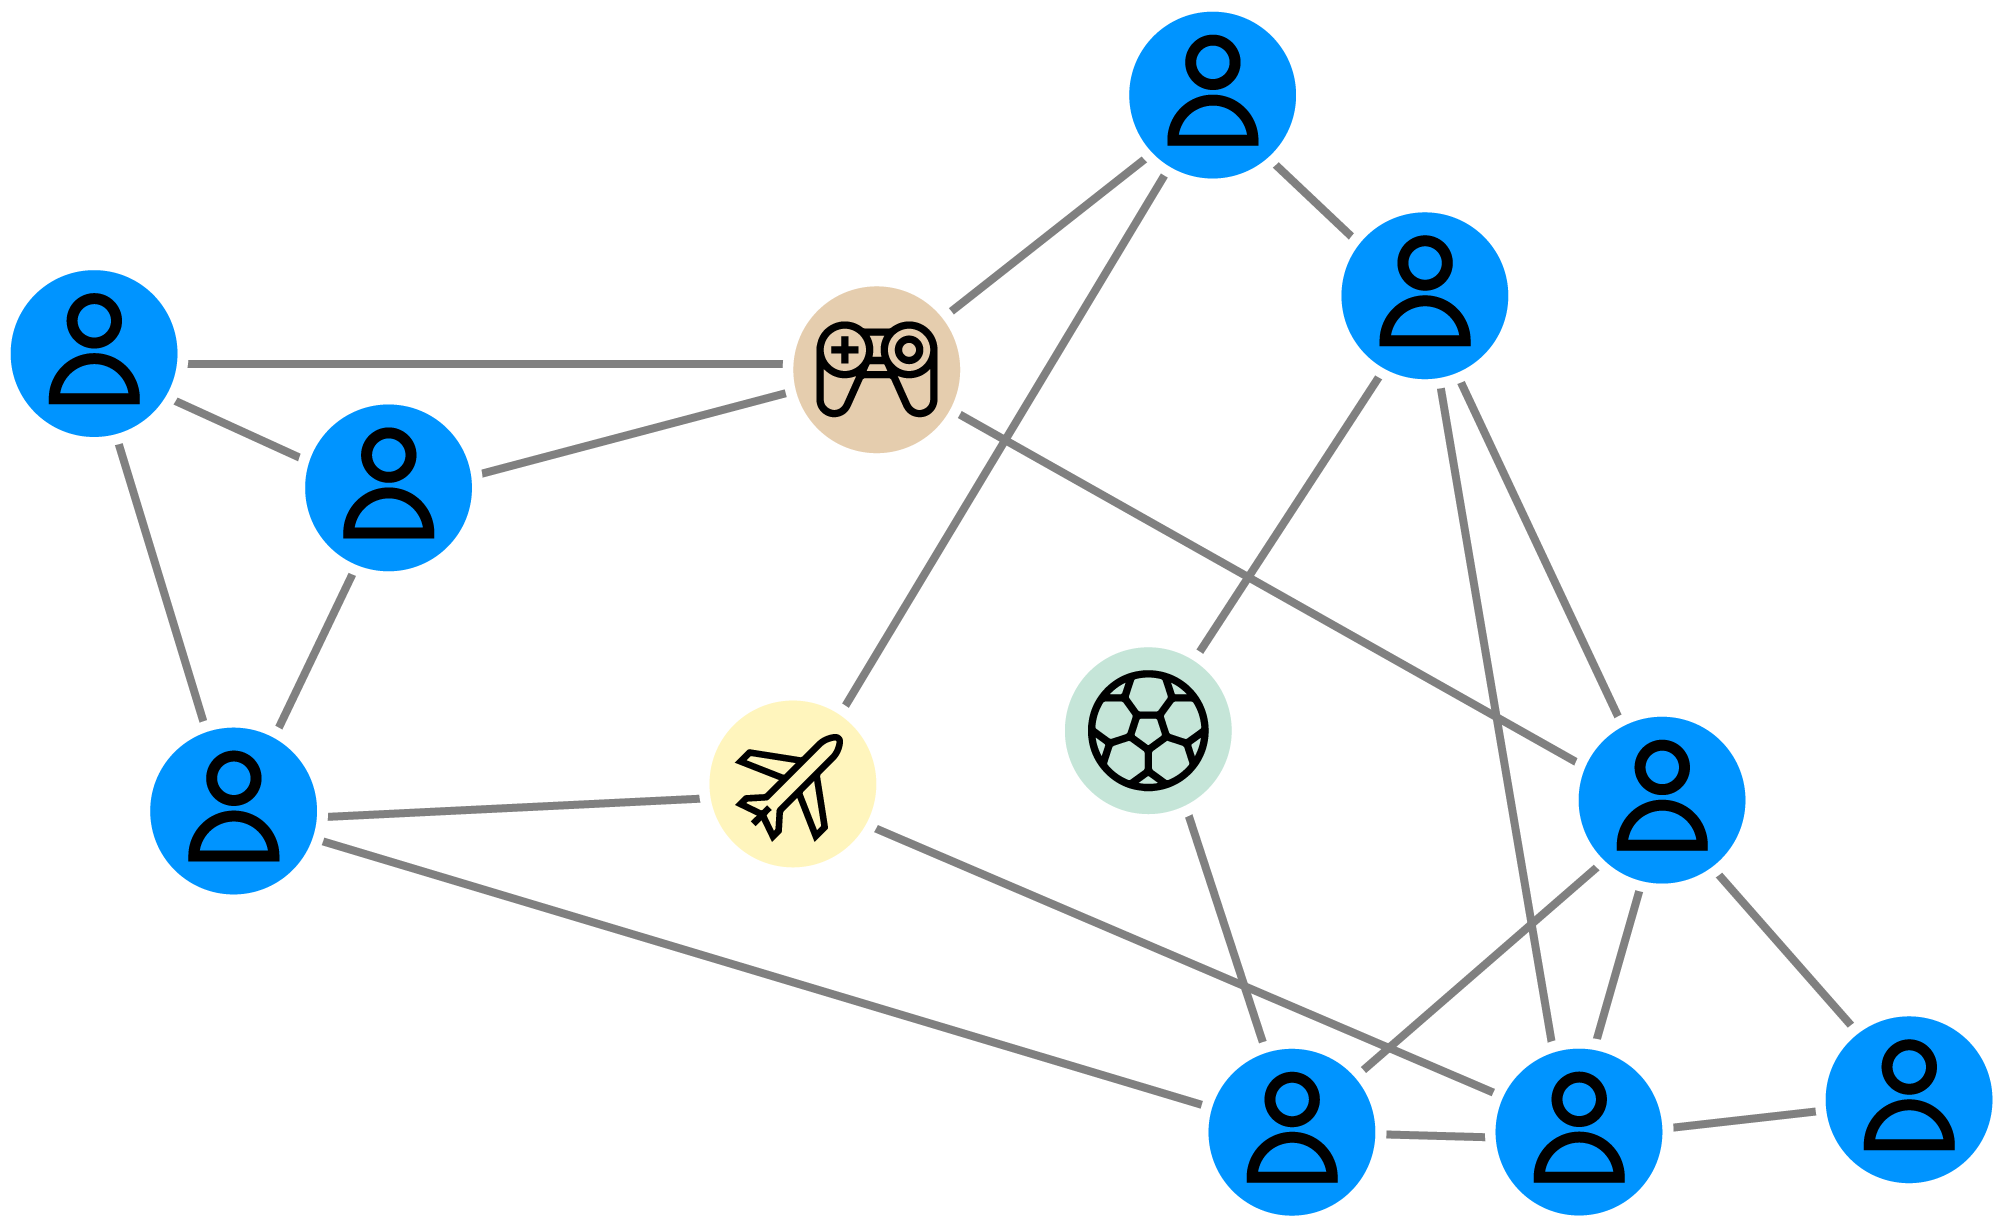
Social networks are all about connections, and networks like Facebook or LinkedIn owe their rise to graph analytics. Many social network features rely on graph analytics:
- Community detection: Graph analytics can identify user communities and recommend groups to other users for more tailored social experiences.
- Content personalization: Graph can personalize social feeds by analyzing user interactions and preferences.
Linkurious is a software company providing technical and non technical users alike with the next generation of detection and investigation solutions powered by graph technology. Simply powerful and powerfully simple, Linkurious Enterprise helps more than 3000 data-driven analysts or investigators globally in Global 2000 companies, governmental agencies, and non-profit organizations to swiftly and accurately find insights otherwise hidden in complex connected data so they can make more informed decisions, faster.