Use cases for graph visualization and analytics in supply chain data analysis
If you’re working in supply chain management, you understand the importance of data-driven decisions. The insights drawn from supply chain data provide organizations with greater visibility and efficiency. But complex supply chains make for complex data landscapes, requiring specific technologies and analytics techniques to break down data silos in order to quickly gain the necessary insights to weather countless potential supply chain disruptions. The Covid crisis, the war in Ukraine and growing tensions with China have highlighted the fragility of some supply chains. Organizations also need to comply with sanctions and other regulations.
In face of this complexity, graph visualization and analytics offer a solution that facilitates supply chain data analysis so you can gain actionable insights that lead to better decision making. In this article, we’ll take a look at where graph visualization and analytics bring value for specific supply chain use cases before taking a deep dive into applying graph to advanced scheduling and supply chain optimization, with an example from Alvarez & Marsal, a leading global professional services firm.
The numbers speak for themselves: 74% of supply chain companies face shortages of critical parts or materials, and 68% of supply chain companies have products being held up in ports or across borders (1). These types of disruptions are a concrete reality for the majority of companies working with complex supply chains.
A limited understanding of connections and dependencies within your supply chain data only exacerbates disruptions. Performing impact analysis, for example, requires understanding the connections between products, parts, components, claims, suppliers, and clients. It’s a lot of data and a lot of moving parts, and when that data is siloed, it can be difficult to extract the insights you need in a timely manner.
Graph technology thrives on connected data, making it a highly suitable solution to analyze data related to supply chains. In a graph, data is structured as nodes - individual entities such as suppliers or warehouses - and edges, which represent the connections between nodes: which suppliers are connected to which factories, for example. Graph technology is a natural way to model networks, lending itself well to visualizing and analyzing even very complex supply chains.
Graph is able to connect event data to supply chain data, product data, and organizational data to give analysts a 360° view of even the most complex supply chains in a single graph. When all the data related to a single supply chain is united as a graph, it becomes possible to understand the hidden connections within that data to perform all kinds of analysis and to make better, more informed decisions.
Conducting supplier impact analysis using Linkurious Enterprise. For a full demo, watch our webinar replay.
Graph technology has a huge number of applications for supply chain management. It can help optimize supply chains by helping find the best route or carrying out what-if analysis. Graph can help with customer 360, showing you everything a customer is connected to help deliver support, or helping with cross-sell or upsell. It’s also an asset for risk management, making it easy to see if your organization is overly reliant on a given supplier or to understand the impact of a supplier being bought out by a competitor. Graph visualization and analytics can also help with warranty analytics, compliance, and more.
Let’s take a closer look at how you can apply graph technology to three of these use cases.
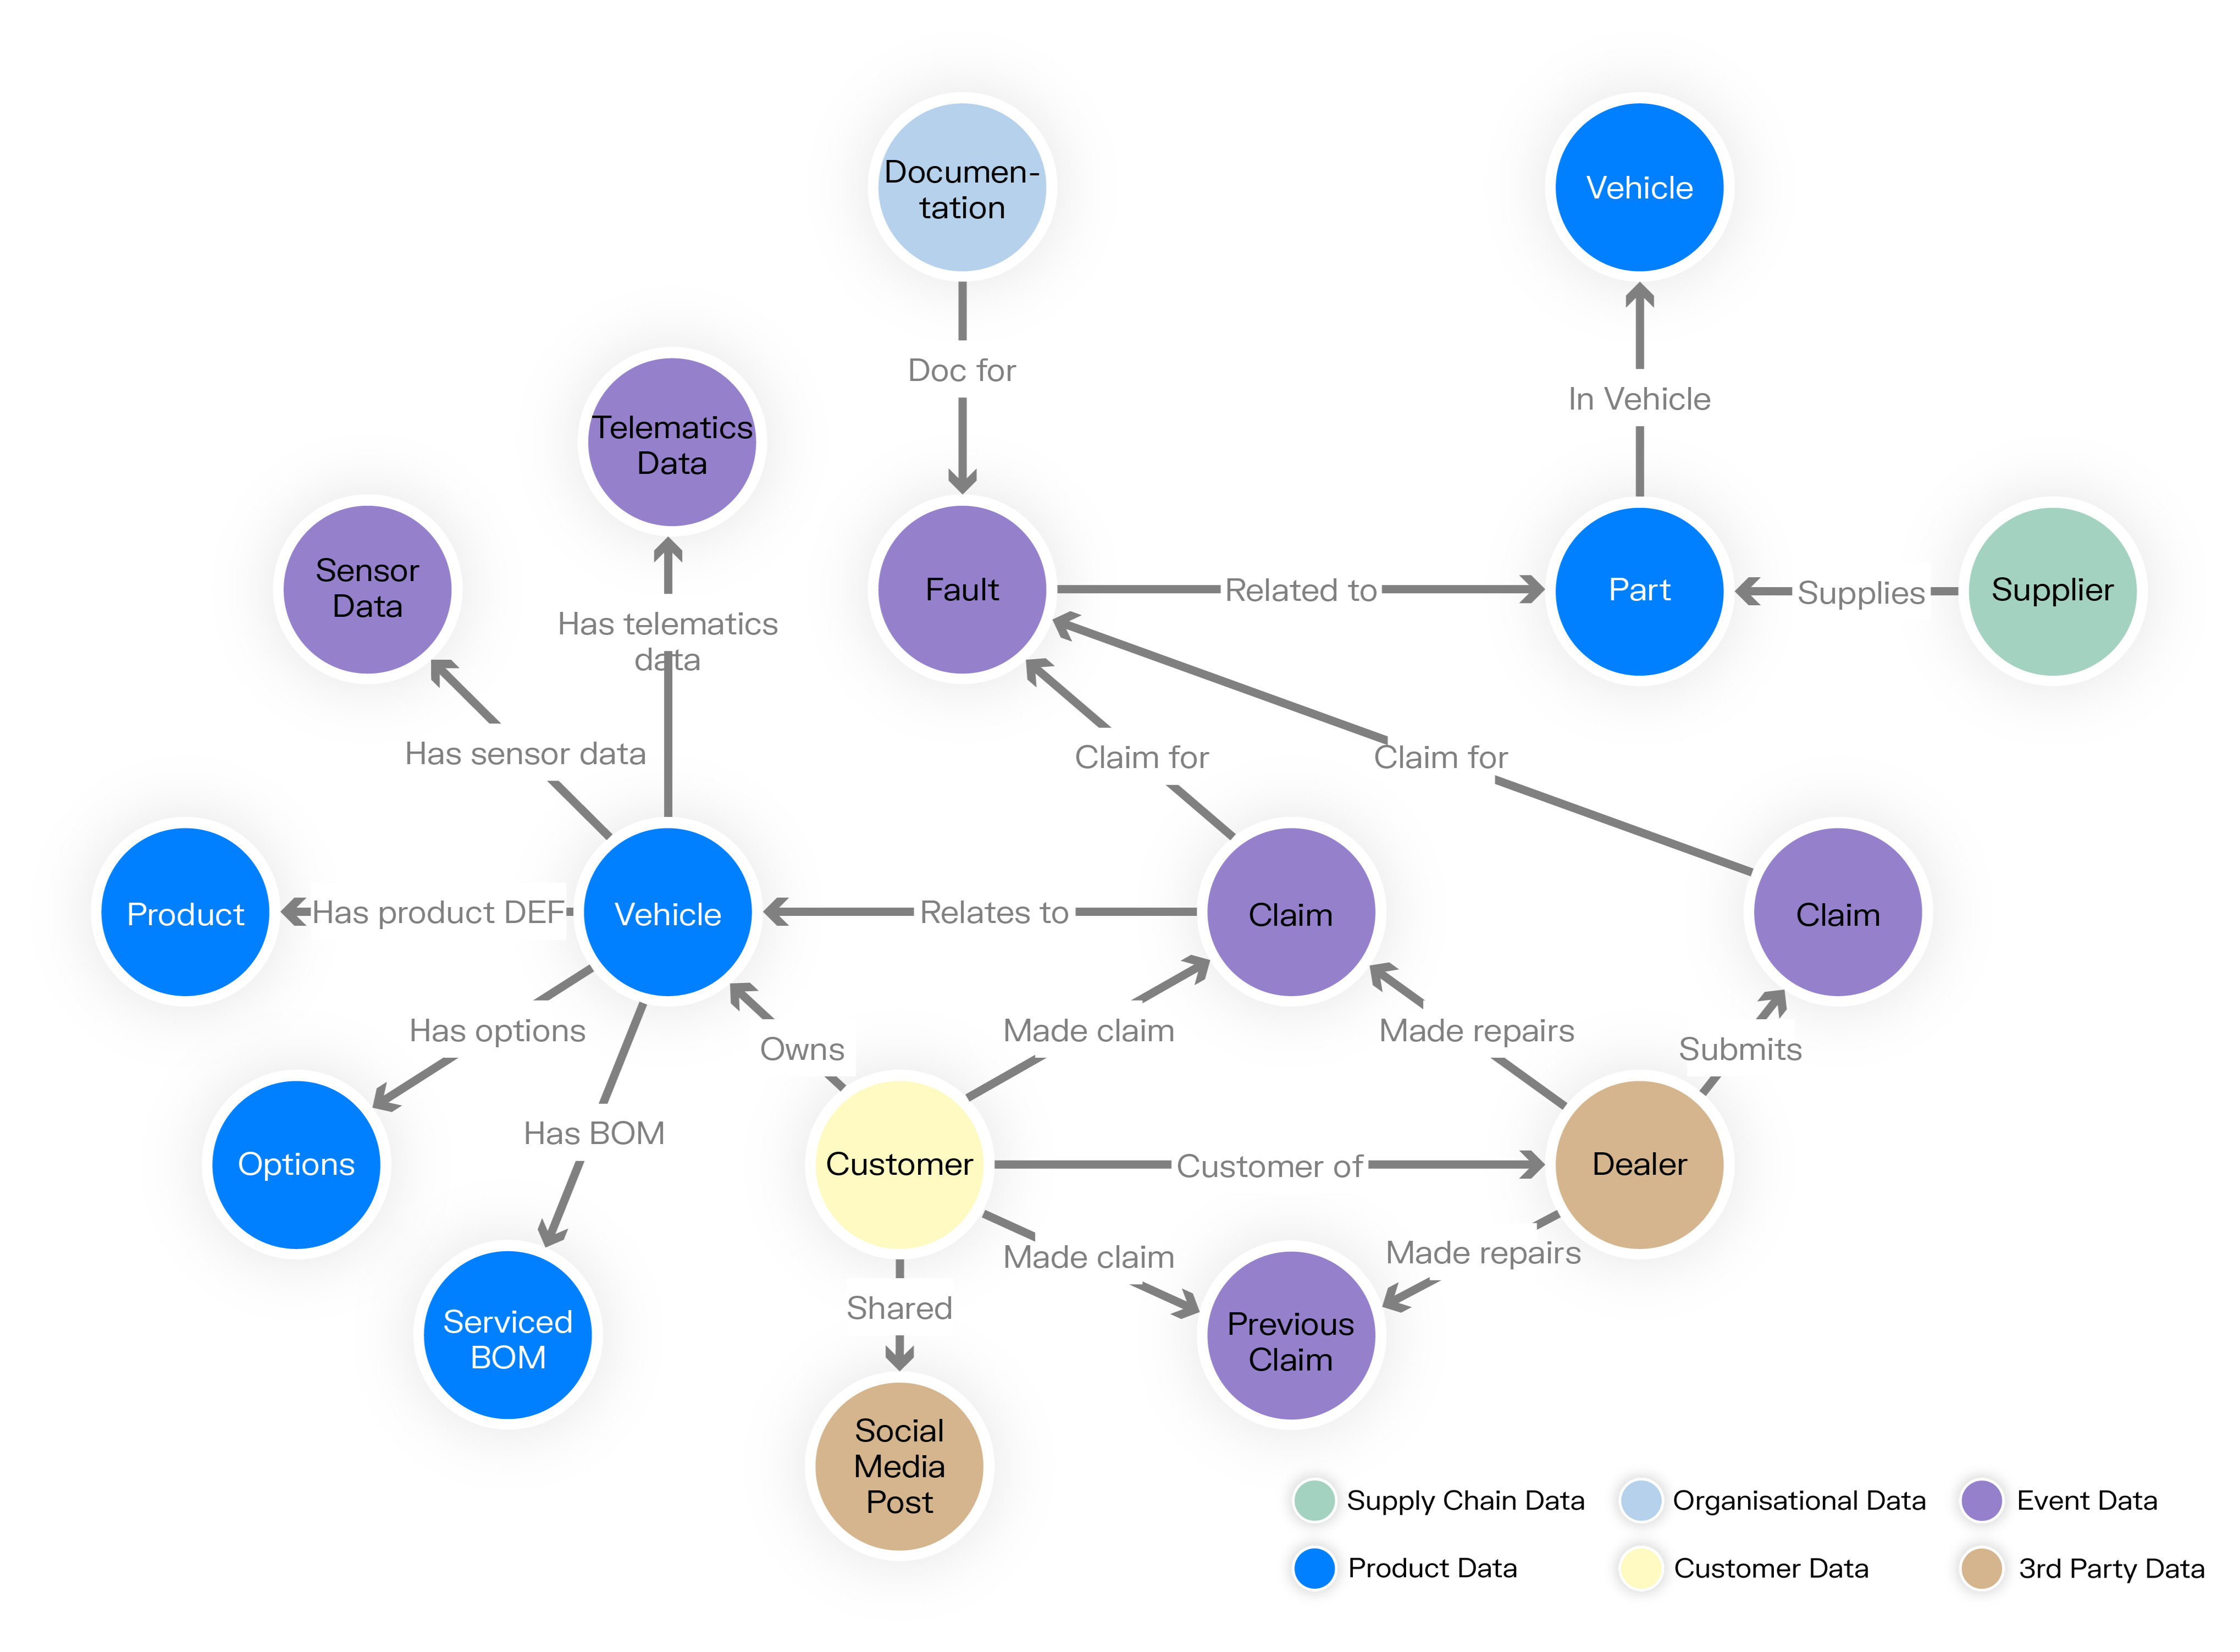
Visualizing your supply chain data as a graph can reveal plenty of useful information relating to product warranties. In this graph, we’ve combined supply chain data, organizational data, event data, product data, customer data, and third-party data (from social media, for example). By combining these data sources and visualizing how they connect to one another, it becomes easy to answer key questions. If one component is faulty, how many vehicles contain that part? And what is the root cause - which suppliers are providing that faulty component? A graph visualization can also quickly show you if a customer is linked to an unusually large number of claims, which may be a red flag for fraud.

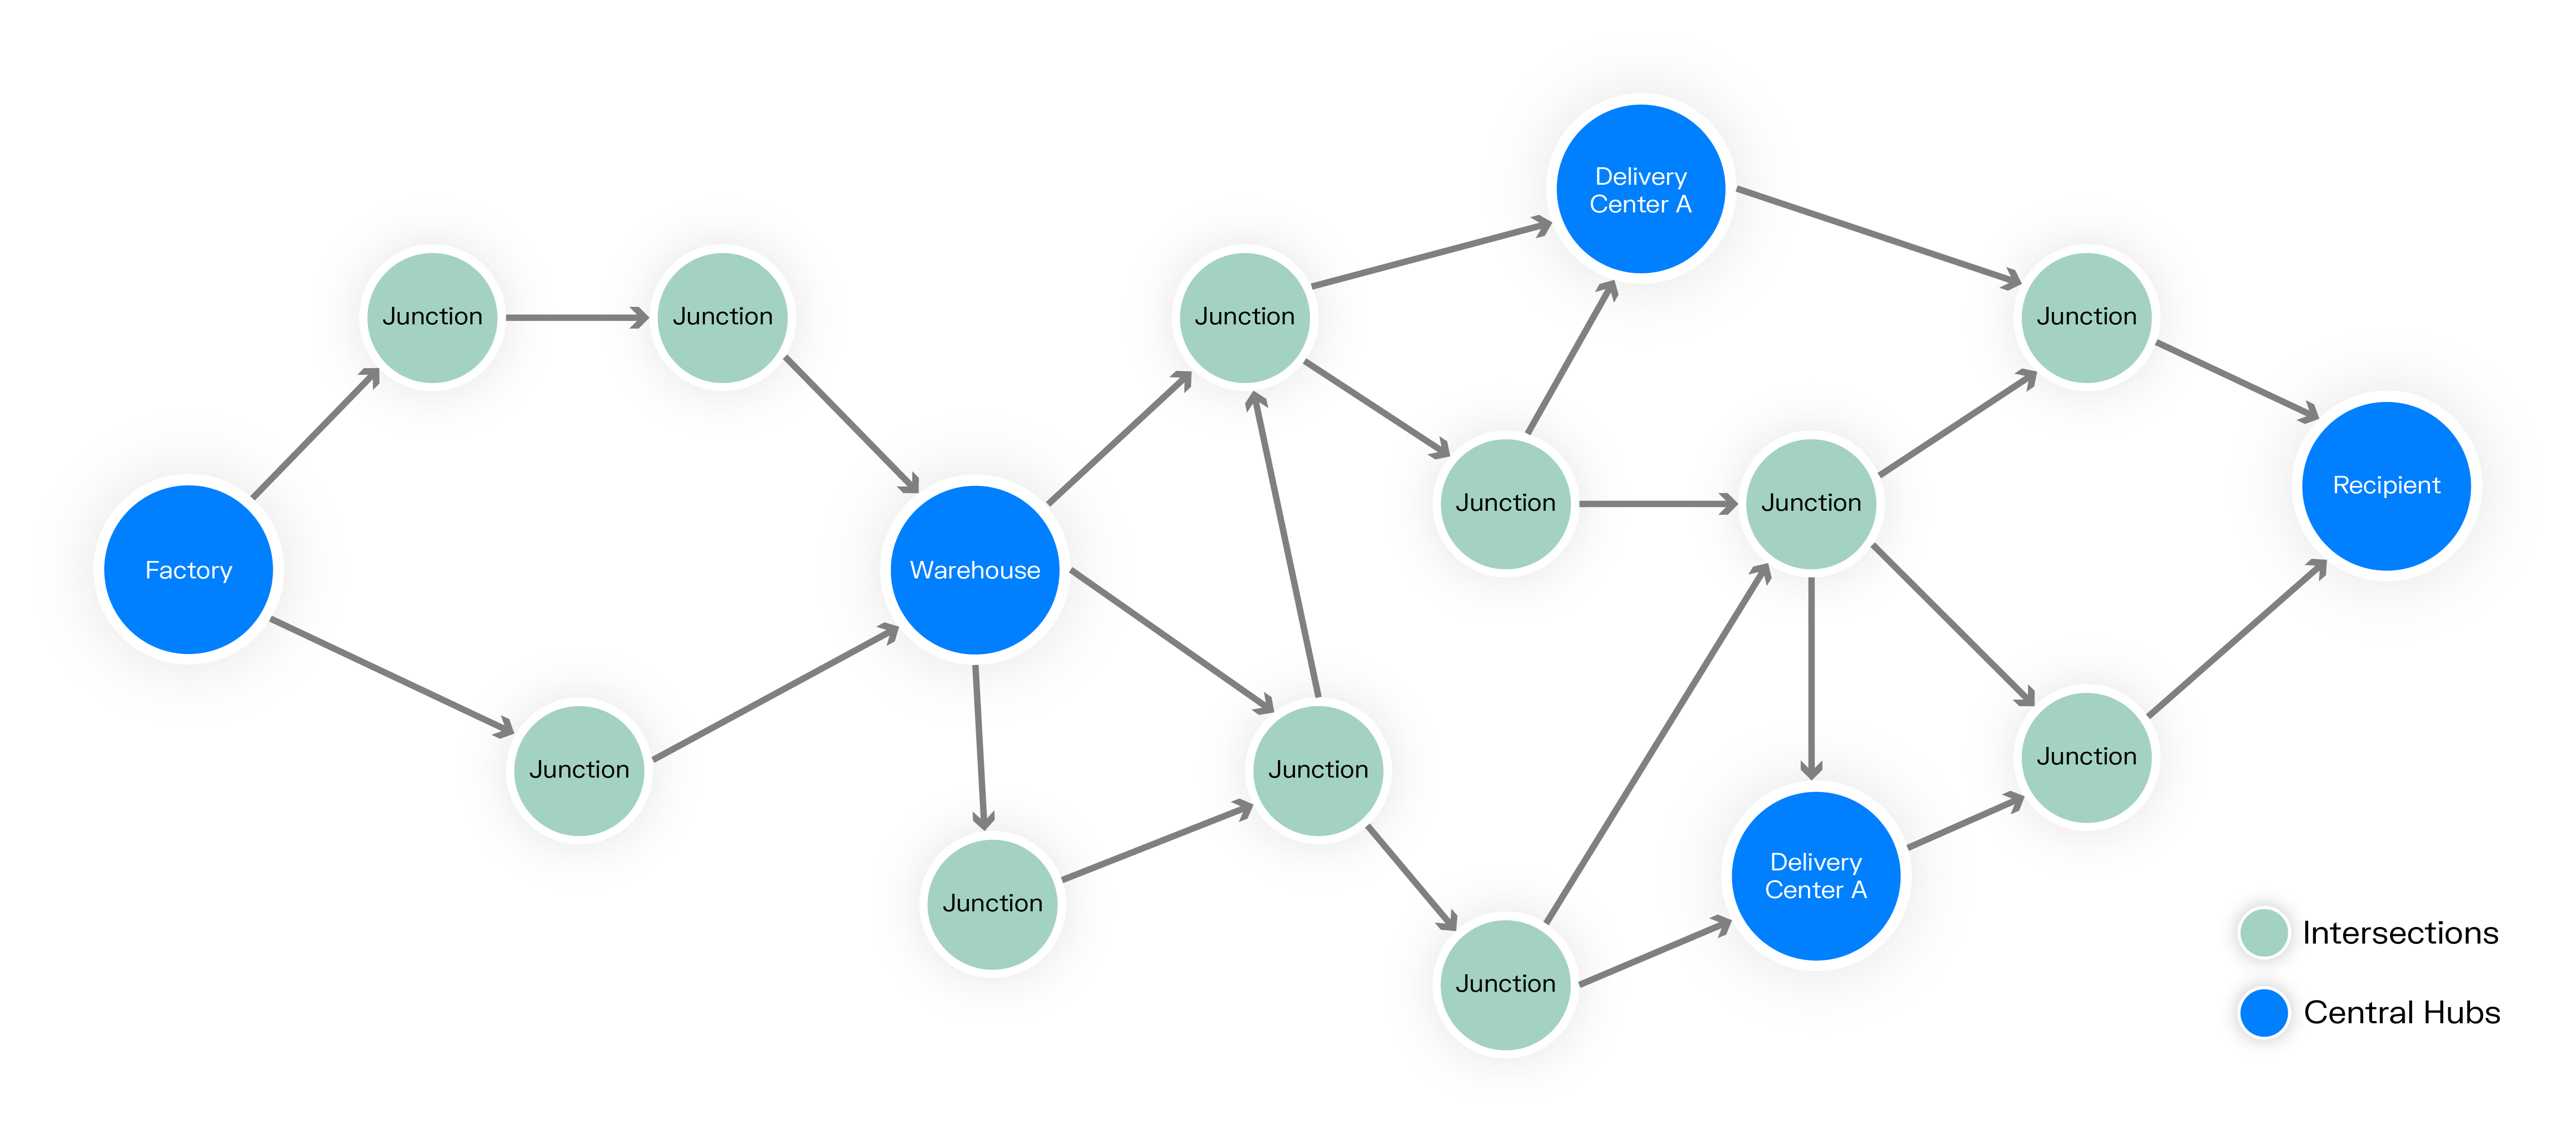
In this example, we’ve put together a simplified visualization of the movement of goods, tracing the chain of movement across various central hubs and key intersections. This kind of graph visualization can be enriched with additional properties such as inventory, average processing time, etc. You can then perform various analyses on this data to understand, for example, what the shortest route is between two points on the graph, or which routes are the least costly.

Any organization working with complex international supply chains knows the importance of complying with regulations such as sanctions. Geopolitical situations can shift quickly, and non-compliance can result in hefty fines, meaning it’s essential to be able to swiftly identify any sanctioned suppliers in the case of new regulations.
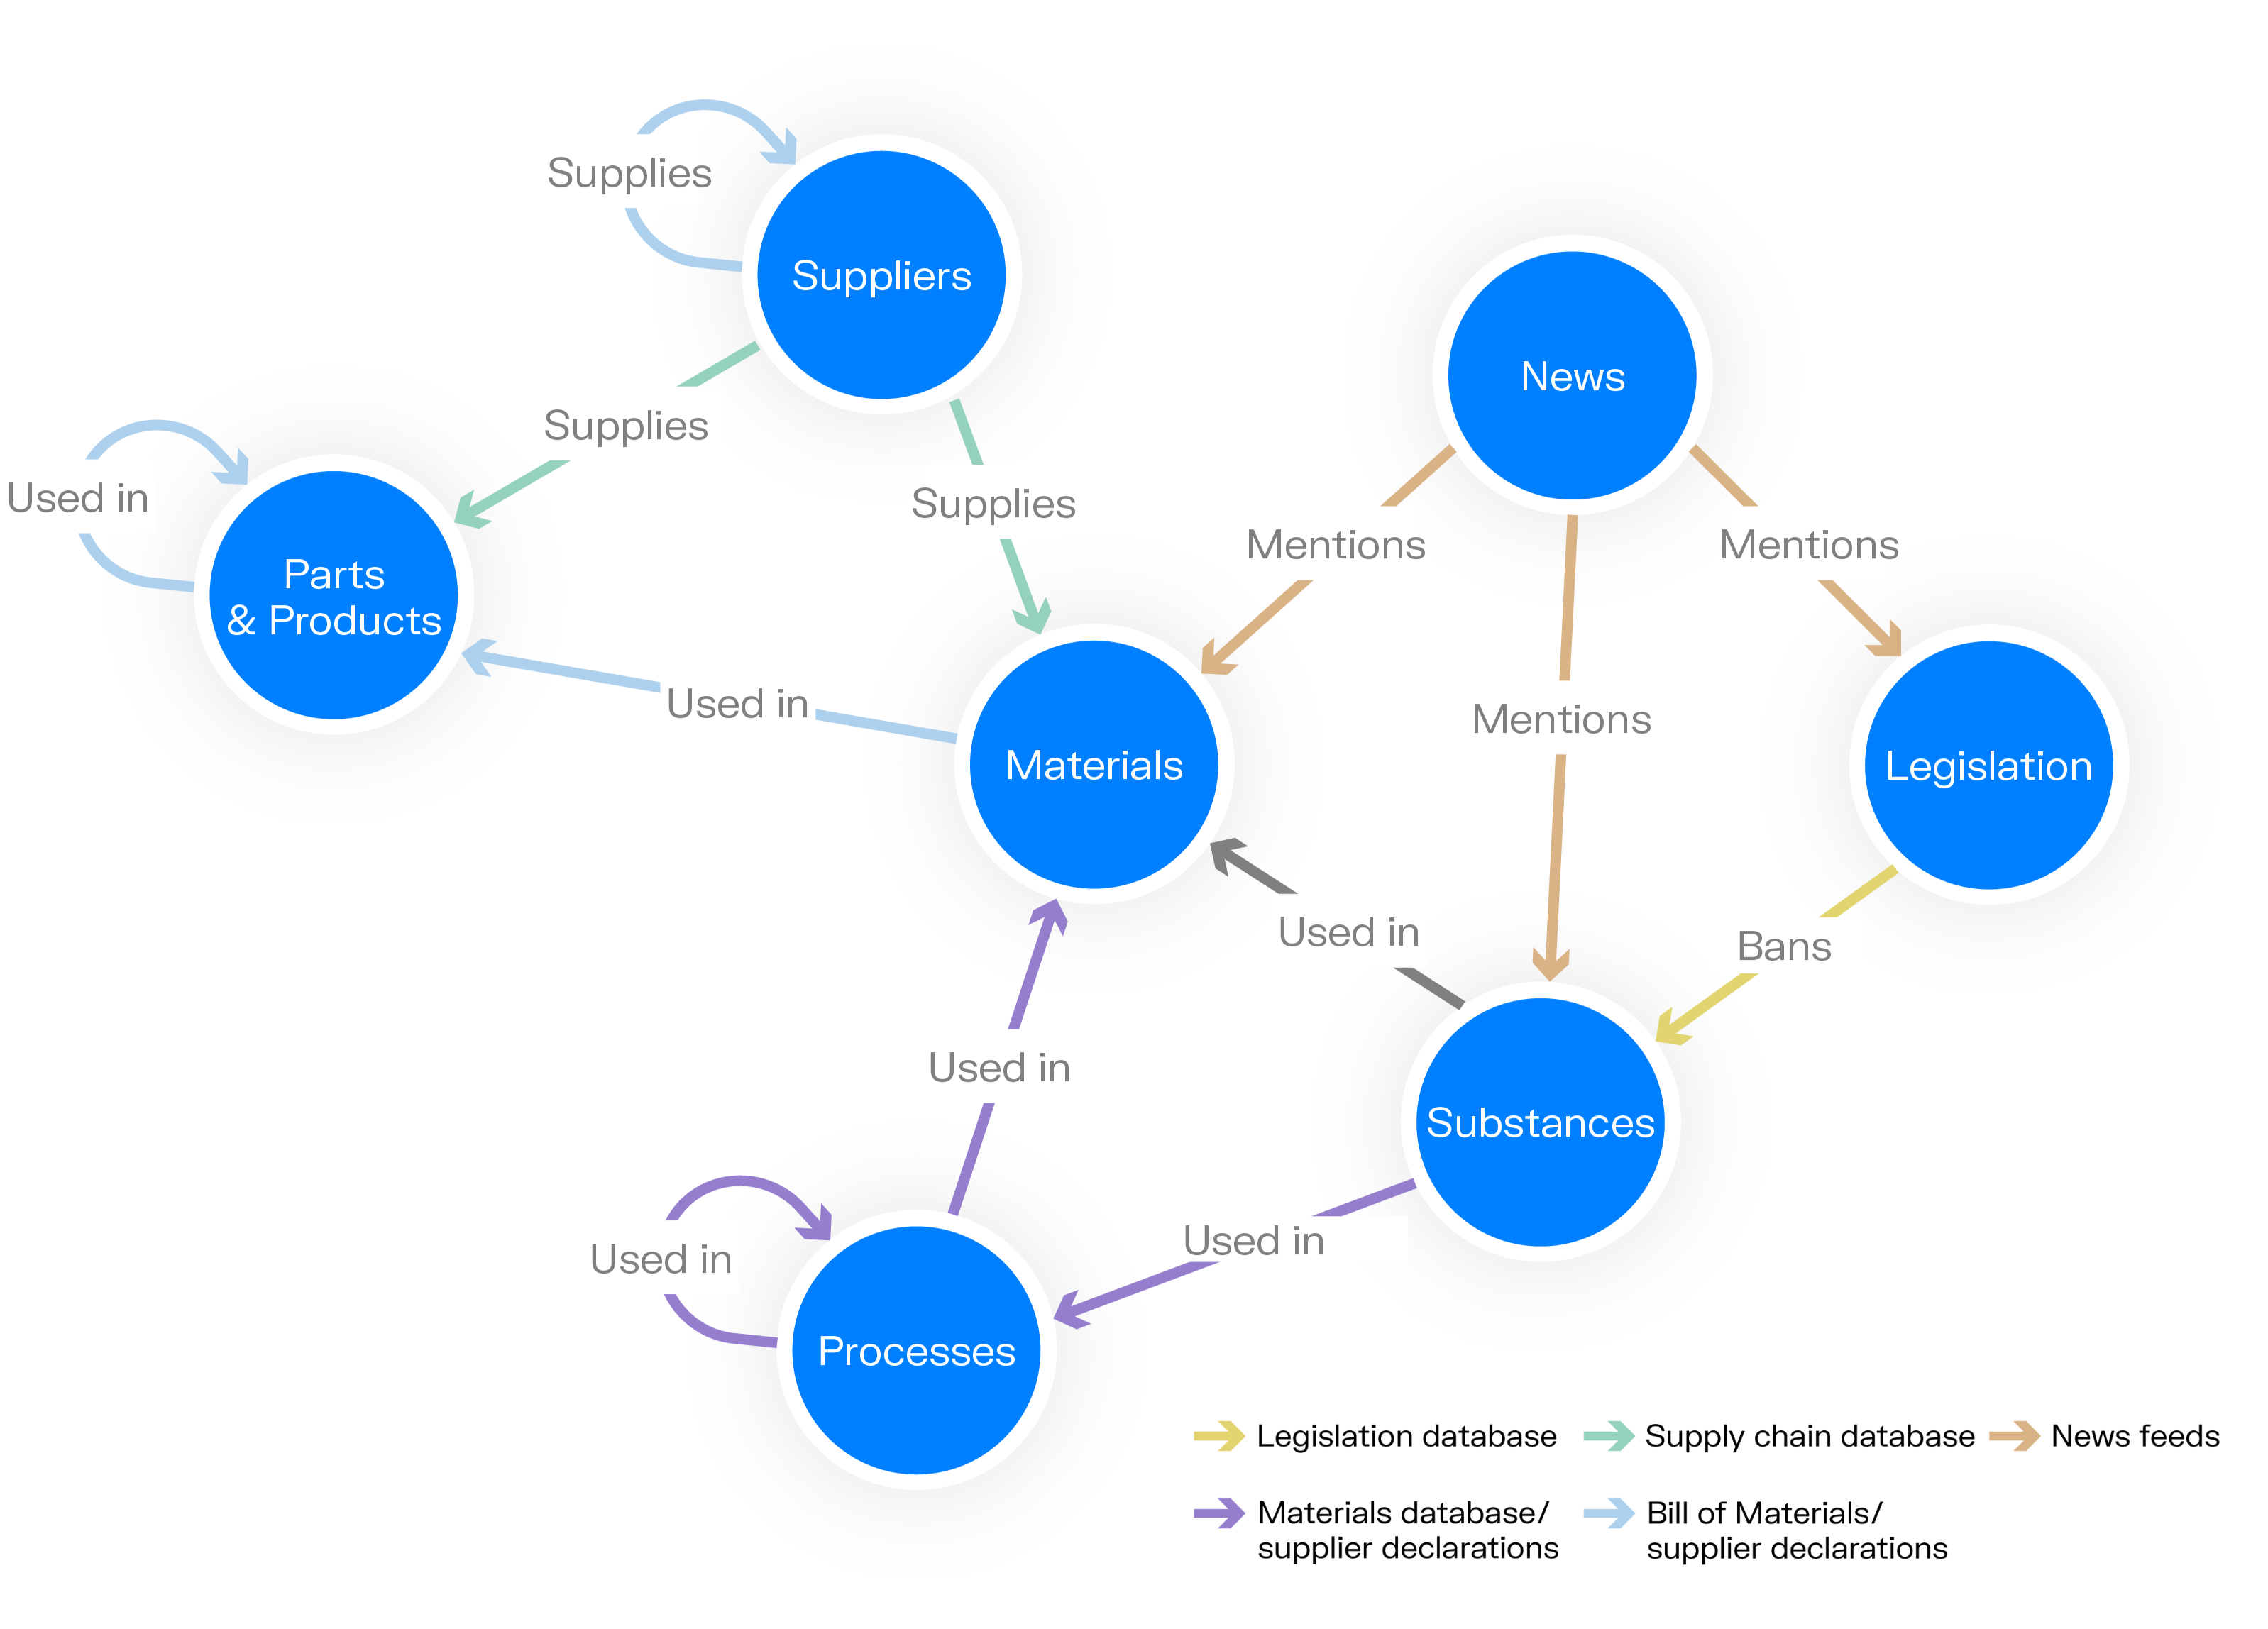
In this visualization, we’ve combined supply chain data with a legislation database, materials databases, BOM declarations, and news data. By combining these data sources into a single graph, you can verify that every step of your supply chain is compliant with current sanctions, with regulations such as REACH (Registration, Evaluation, Authorization and Restriction of Chemicals, an EU regulation), etc.

One of the challenges for organizations in their supply chain operations is that there is often waste built into supply chains, for example unnecessary lag times as components or products move through the supply chain. This becomes even more challenging to manage when there are variations in the supply chain due to myriad factors - as there inevitably will be, on a daily basis.
The logistics of moving freight is an example of this. There are multiple hand-offs as freight moves from point A to point B, and each of those hand-offs can create waste. Traditional methods of managing supply chains are important: they allow you to take action and react to problems in your supply chain. But the drawback is that they typically don’t enable you to react in real-time.
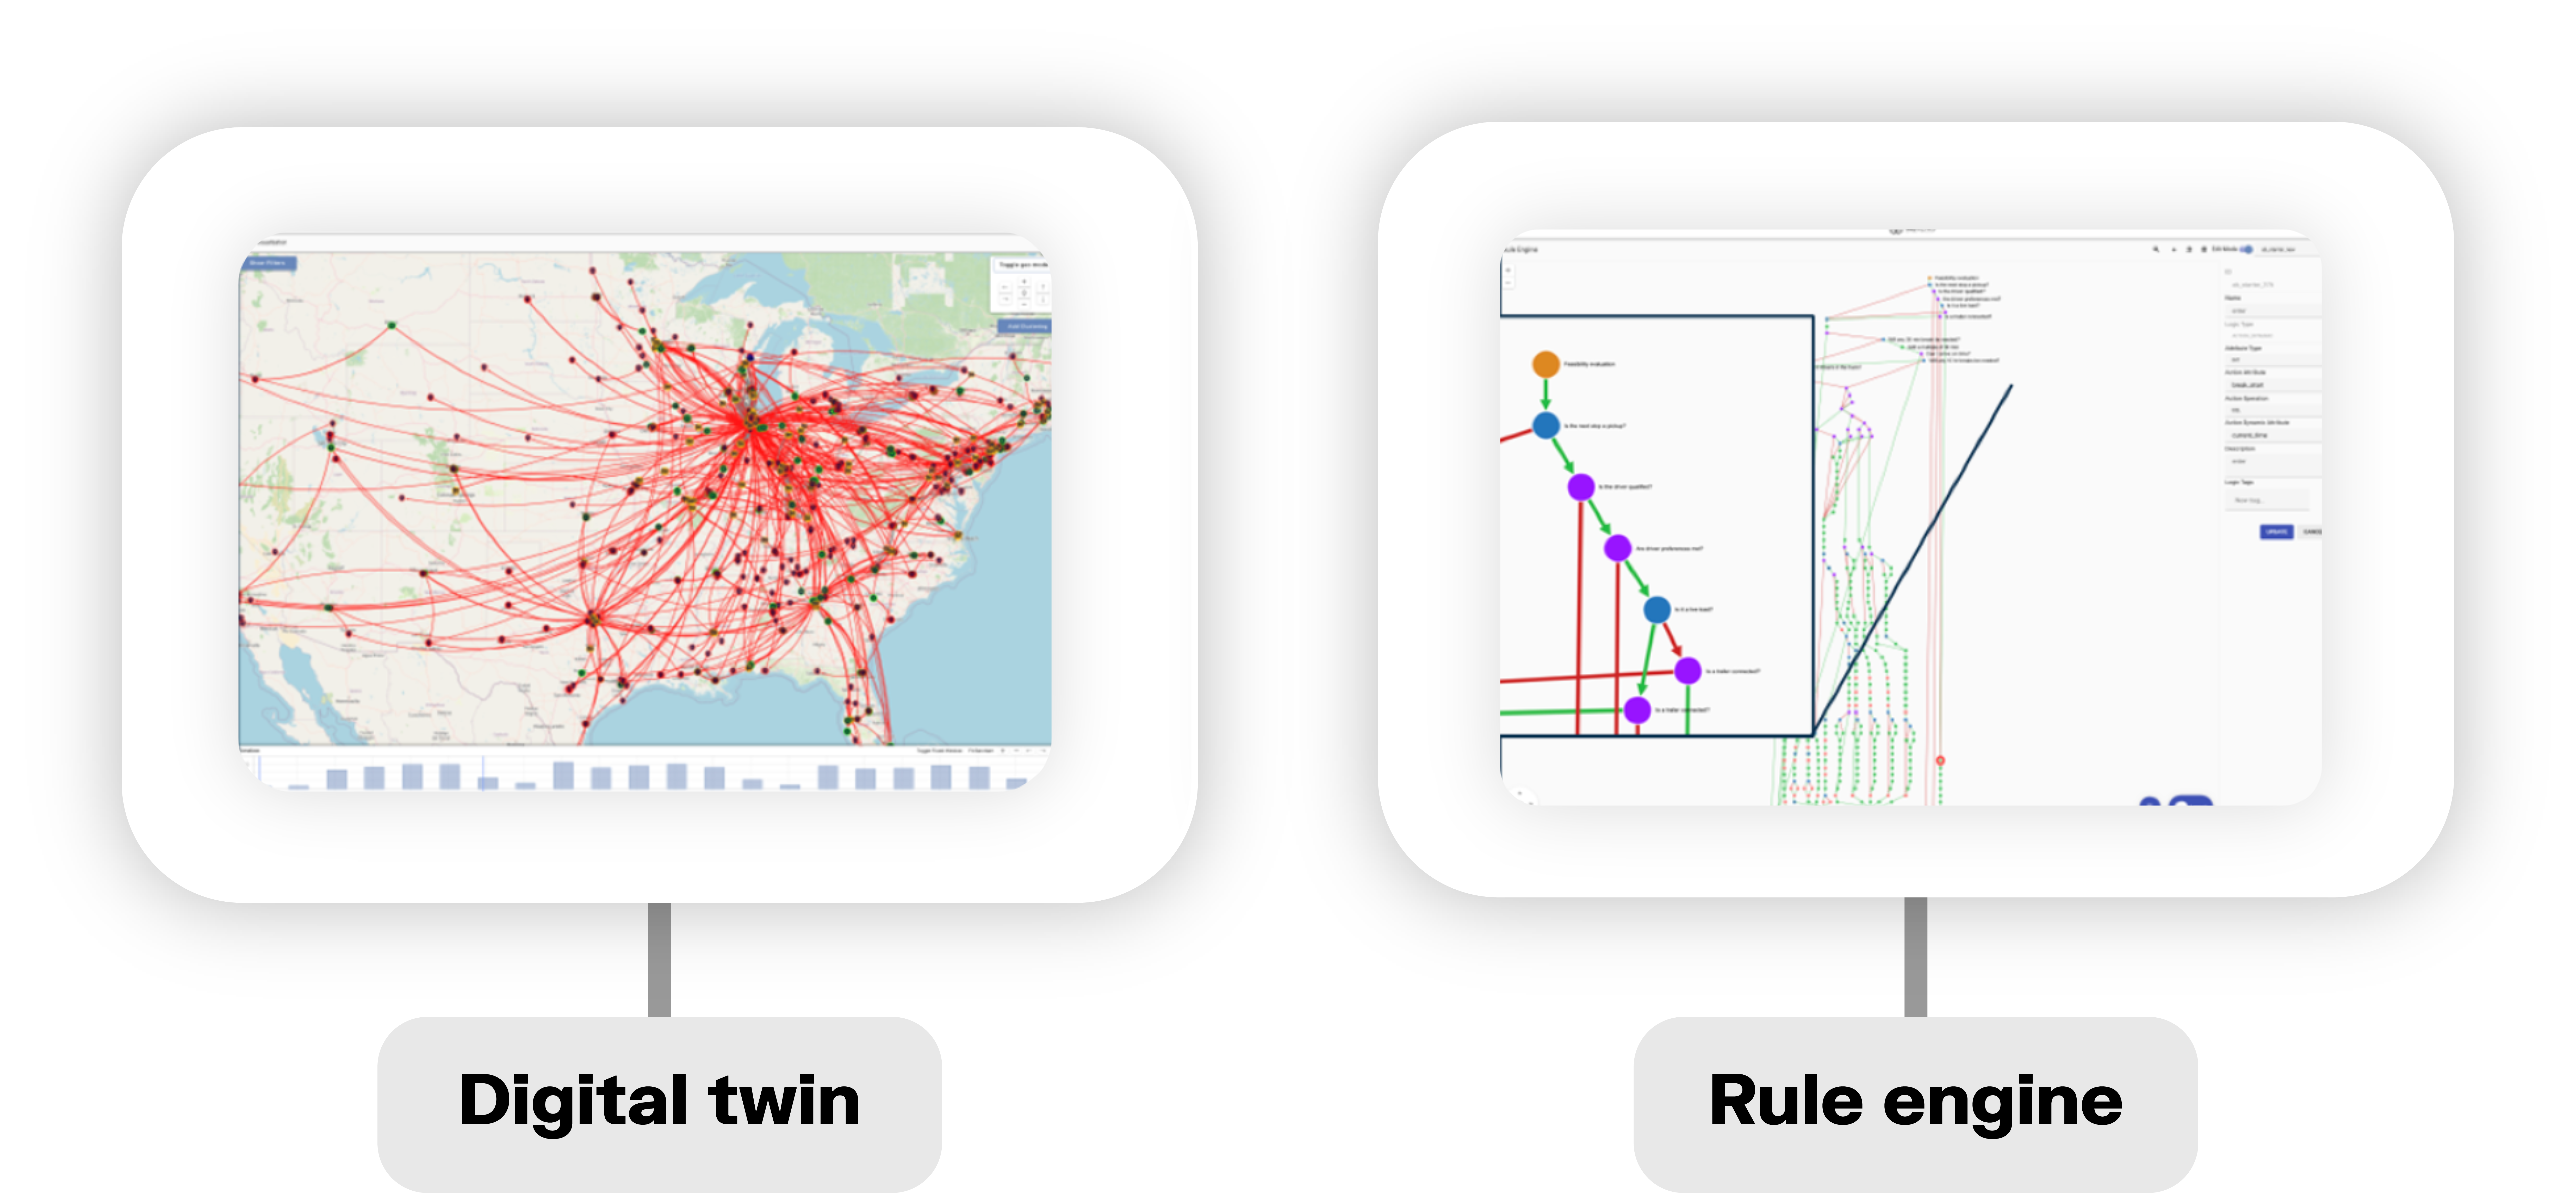
In a recent joint webinar, Frederic Ramouille of Alvarez & Marsal, a leading global professional services firm, presented an example of a solution using graph visualization and analytics for advanced scheduling and supply chain optimization in real-time. The graph solution enabled them to process real-time changes and recalculate optimum plans, control supply and demand commitments dynamically, and maintain an optimal, forward-looking digital twin. They applied this solution to a logistics system dealing with hundreds of trucks in a complex, nation-wide network.
To do this, they used two different graph models:
- A digital twin. This graph model mapped every location, truck stop, refueling station, alongside traffic conditions, transit times, and more.
- A rule engine. This included use cases in the form of complex decision trees made up of conditional nodes (action nodes and decision nodes), as well as models of behavior: what to do when a driver is sick, what to do when a truck has a flat tire, etc.
These two different models were set up to “talk” to each other in a graph-to-graph communication. The digital twin asks questions of the rule engine, depending on what exact scenarios are occurring in the field. The system is designed to model the future and figure out what to do in the face of changes. Answers are calculated in a matter of seconds to identify the best way to move forward.

The engine was tested on a fleet managing some 1500 loads per day. It proved capable of calculating tens of thousands of possible assignments in a matter of seconds, and in a few seconds more it finds the most optimized assignments over the period of a week.
The possibilities around using graph visualization and analytics for supply chain management are vast. To take a deeper look at the topics in this article, watch the recent joint webinar we organized with Alvarez & Marsal.
(1) https://static1.squarespace.com/static/590a2d39e4fcb5f1d7b2f0f9/t/6453cb39eb10a6246dbd1f4a/1683213119354/Neo4j-GLDA23.pdf
A spotlight on graph technology directly in your inbox.


