Public sector fraud is a recurring challenge globally. In Europe, the value-added tax (VAT) is sometimes targeted by criminals who mount complex fraud schemes to defraud states. VAT fraud, or missing trader fraud, can cost countries hundreds of millions of euros.
Because of its complexity, VAT fraud can be hard to track down. But using graph analytics and visualization technology, investigators can track down entire fraud rings quickly. This article takes a look at how VAT fraud works, and how graph technology can come to the aid of fraud investigators.
The value-added tax, or VAT, is a consumption tax assessed on the value of goods and services. In countries that apply it, like the European countries, consumers pay the VAT every time they buy a product or service. It’s an important source of income: France, for example, brought in more than 176 billion euros with the VAT in 2023. That is considerably more than what French citizens pay in income tax.
Contrary to sales taxes, which are paid and calculated once, VAT involves a lot of paperwork, since each company has to keep track of it when it makes a transaction. This is true regardless of whether it is dealing with a simple consumer or with another business.
VAT is complex and involves large sums of money. It’s no surprise fraudsters try to take advantage of this. In Europe, this occurs through a type of fraud called carousel fraud, or missing trader fraud.
As an example, Italy’s financial authorities alongside the European Public Prosecutor’s Office (EPPO) arrested five individuals in 2024 involved in a VAT fraud scheme. The fraudsters had stolen 220 million euros by fraudulently stating that shipments of alcohol were destined to other EU markets instead of the domestic market.
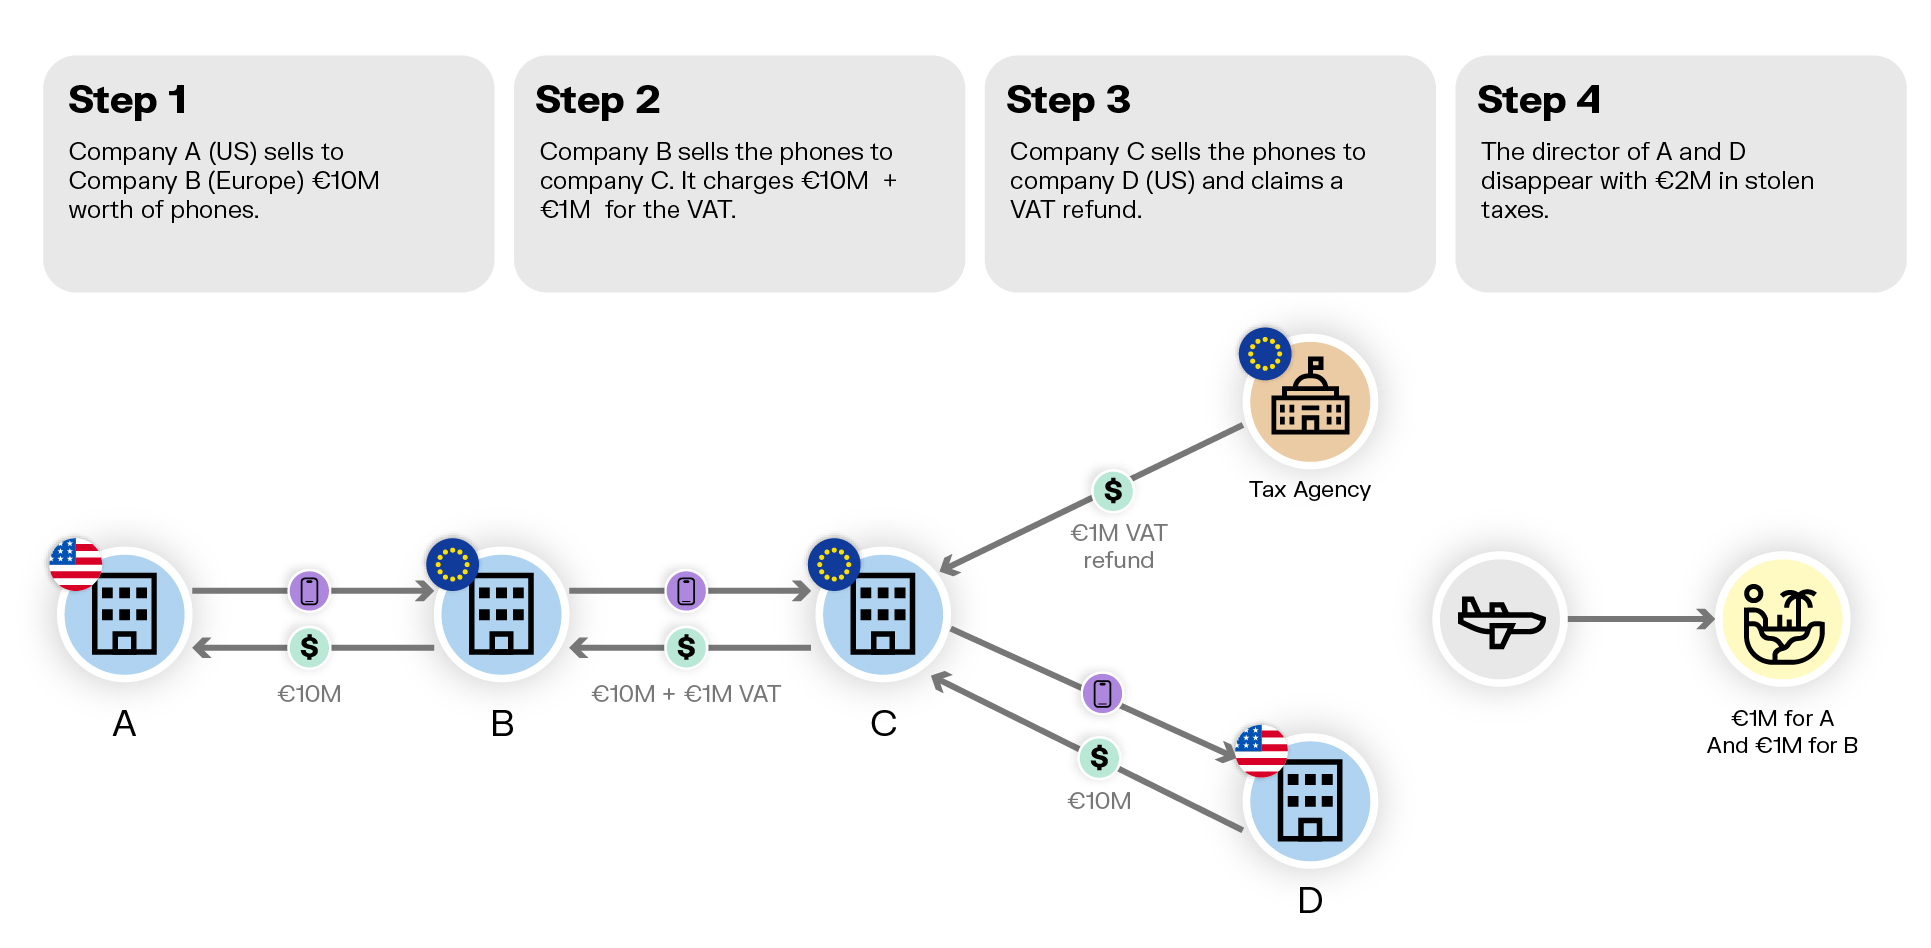
In VAT fraud or carousel fraud, a fraudster imports goods VAT-free. He sells the goods to a company controlled by an accomplice and charges him VAT. The goods are then sold through a series of companies, each liable to VAT, and finally exported.
The first link in the chain always disappears. The fraudster vanishes with the VAT that he has charged to his customer and that he should report and transfer to his country’s tax agency. The final link also disappears, but not before he has reclaimed the VAT it has paid from the tax agency.
Carousel fraud is a particularly sophisticated scheme. The criminals have to invest money, create companies and execute a series of transactions in a short amount of time to be successful. This type of fraud remains a problem, though, since the proceeds can be substantial, with tens or hundreds of millions of euros on the line.
Beyond that, VAT fraud is hard to prove and even harder to detect before the criminals vanish. But graph technology offers a fast and effective way to unravel VAT fraud schemes.
Graph analytics and visualization are effective tools for VAT fraud detection. In a graph technology model, data is structured as a network. Individual data points are stored as nodes, which are connected to each other by edges, representing the relationships between them. Using a platform like Linkurious, you can quickly search and explore your data as a network, leveraging powerful analytics to automatically detect suspicious connections to quickly uncover fraudulent patterns at scale.
For this example, we’ve prepared a dataset that represents the kind of data national tax agencies can have on the fraudsters. It includes company information, business transactions, tax reports, and access to a blacklist of known fraudsters. Each of these sources of information can help tax investigators identify fraudsters.
A typical problem is that information like this exists in separated silos. It is thus very hard to piece it together and build a complete picture. Criminals use this to their advantage and slip through the cracks.
A graph data model helps us solve the technical dimension of the challenge:
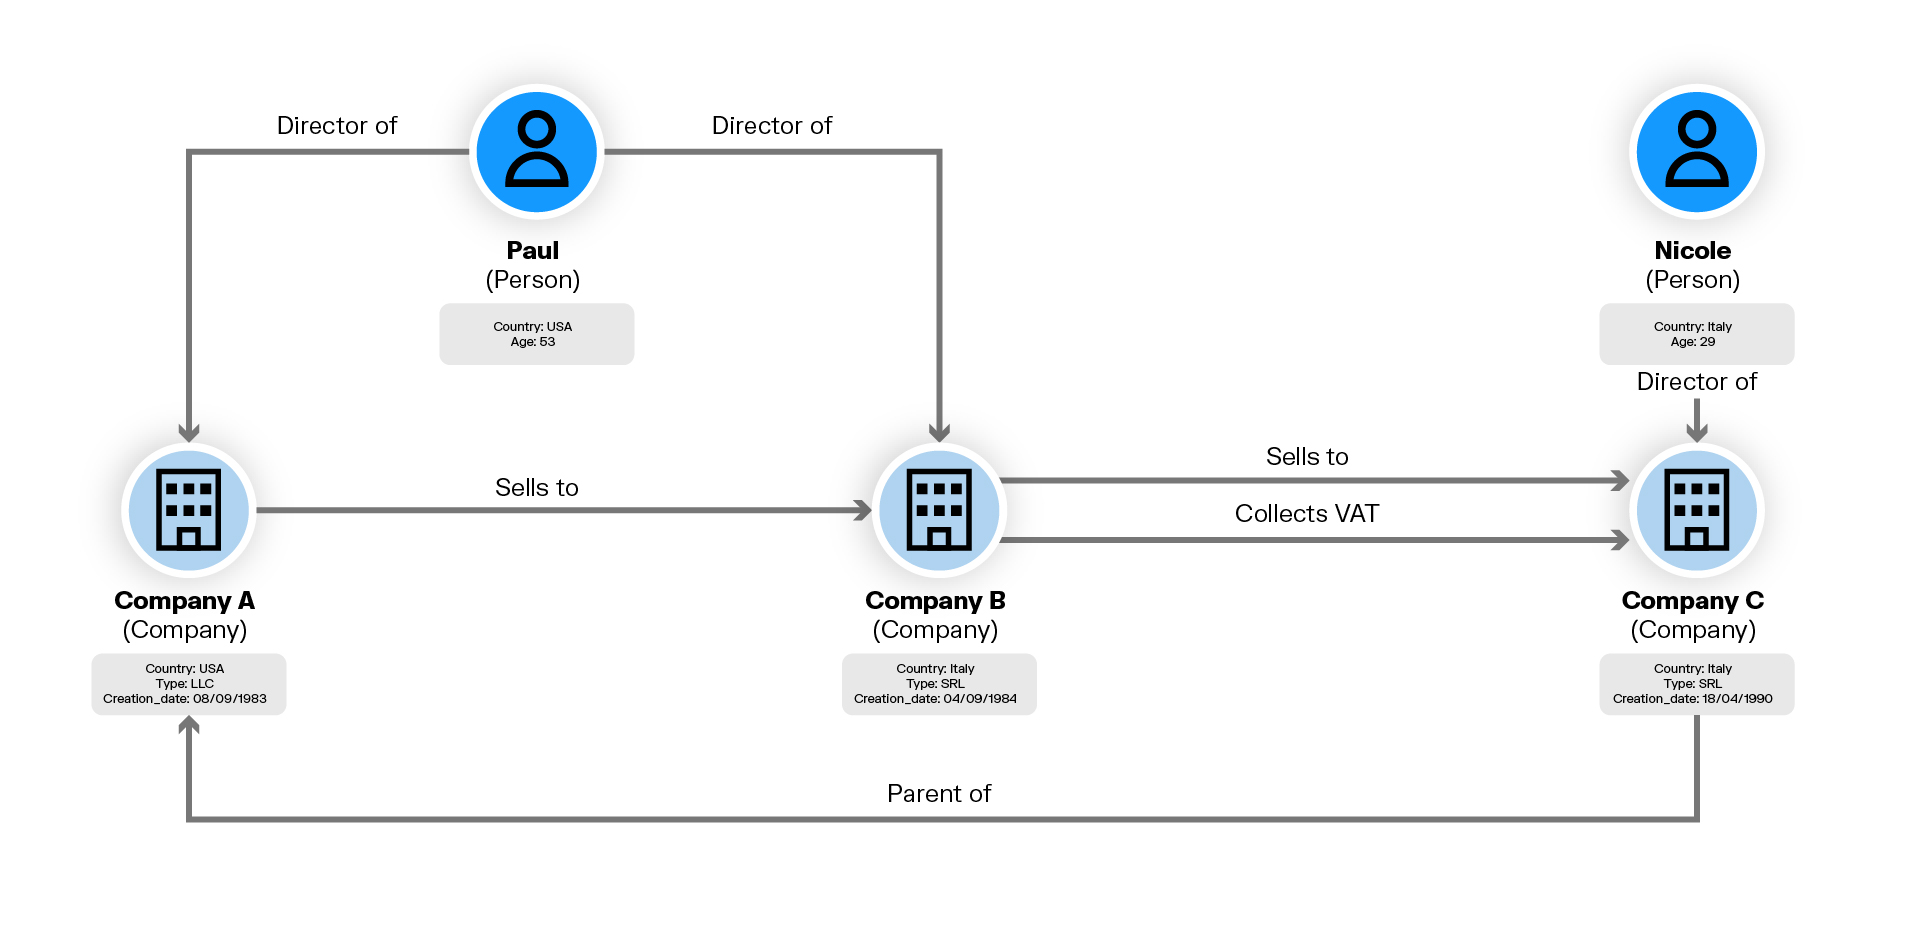
Here we can see in a single picture how each entity relates to the others.
This is one of the advantages of graph: it makes things easier and more intuitive to understand. Furthermore, the graph data model allows us to ask questions by looking at all the data at the same time, instead of focusing on a specific silo.
The traditional fraud detection systems VAT fraudsters know how to bypass use statistical techniques to identify, for example, a suspicious company, set of transactions or individual profile. Each result is interesting, but we want to look across the different data sources to more quickly and accurately identify a potential criminal ring.
Let’s look at how graph analytics can help us identify VAT fraud in our dataset.
To identify potential fraudsters in our data, we need to identify specific patterns that are commonly associated with VAT fraud. In this case, we’re going to look for:
- A set of at least three transactions that includes companies from two different countries;
- Patterns in which the company in the middle of the series appears to be young (fraudsters like to create dummy companies they can easily discard when they disappear);
- The transactions have to occur in a short amount of time;
Together, these characteristics define a fraud pattern. Fraud analysts are experts at articulating these patterns. It reflects their experience and the signs they look out for to identify them. But even the most experienced fraud analysts can’t analyze hundreds of millions of data points. That’s where graph comes in.
There are different options and tools you can use to analyze your graph data. For this example, we are using Neo4j graph database. It uses a query language, Cypher, designed to search data for patterns in graph data.
Here’s the Cypher query that will return us all the companies that match the VAT fraud pattern above:
MATCH p=(a:Company)-[rs:SELLS_TO*]->(c:Company)
WHERE a.country <> c.country
WITH p, a, c, rs, nodes(p) AS ns
WITH p, a, c, rs, filter(n IN ns WHERE n.epoch - 1383123473 < (90*60*60*24)) AS bs
WITH p, a, c, rs, head(bs) AS b
WHERE NOT b IS NULL
WITH p, a, b, c, head(rs) AS r1, last(rs) AS rn
WITH p, a, b, c, r1, rn, rn.epoch - r1.epoch AS d
WHERE d < (15*60*60*24)
RETURN a, b, c, d, r1, rn
These lines of code analyze the data to detect potential cases of carousel fraud. In a real-world application, this query could be run when a new transaction occurs, when a fraudster is added to the financial crime blacklist, etc. In Linkurious, you can also set up this query to run as an alert at regular intervals.
Once you surface patterns of interest in your data, the next step is to investigate to determine if they are genuine cases of VAT fraud or false positives. That is where graph visualization comes in.
Graph visualization enables analysts to see their data as a network. It’s an intuitive way to investigate even complex fraud patterns. Here is the network our fraud query returns:
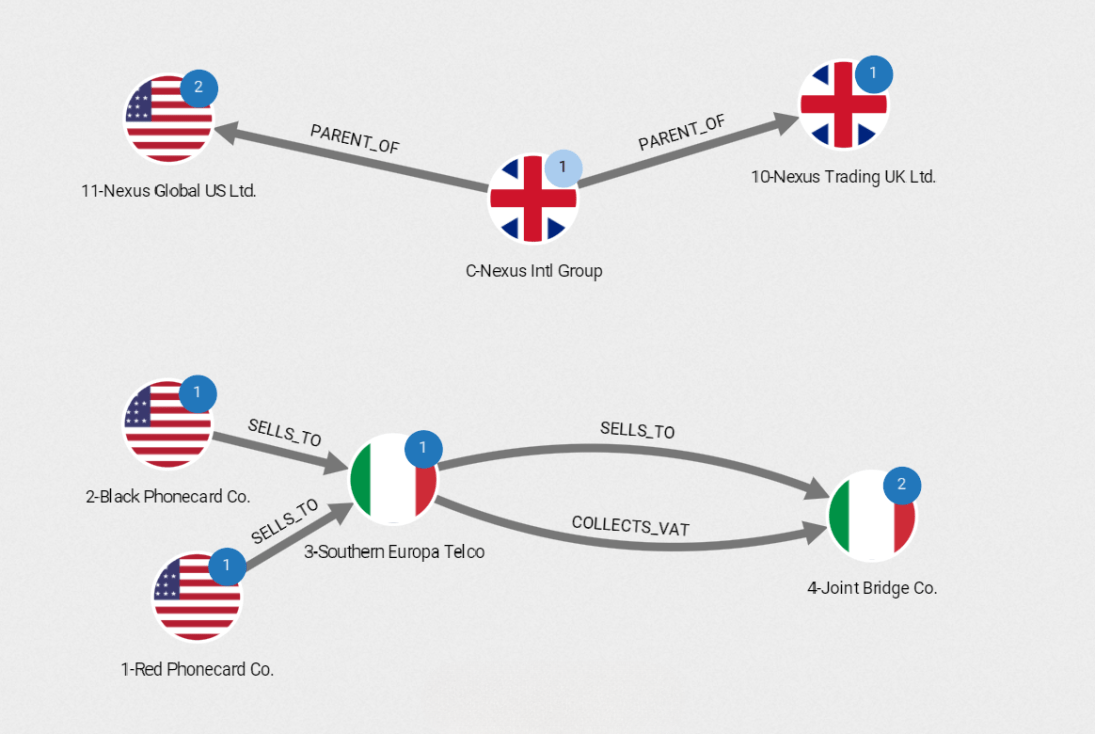
We can see two transaction chains that match our pattern. We see Italian companies, a US company, and a UK company.
In a real-life scenario, this visualization would be the starting point of the investigation, not its end. Are these transactions really criminal? Who are the entities involved? How much is at stake? Graph analytics and visualization tools like Linkurious let you take a deeper dive into your data to find the answers to these questions.
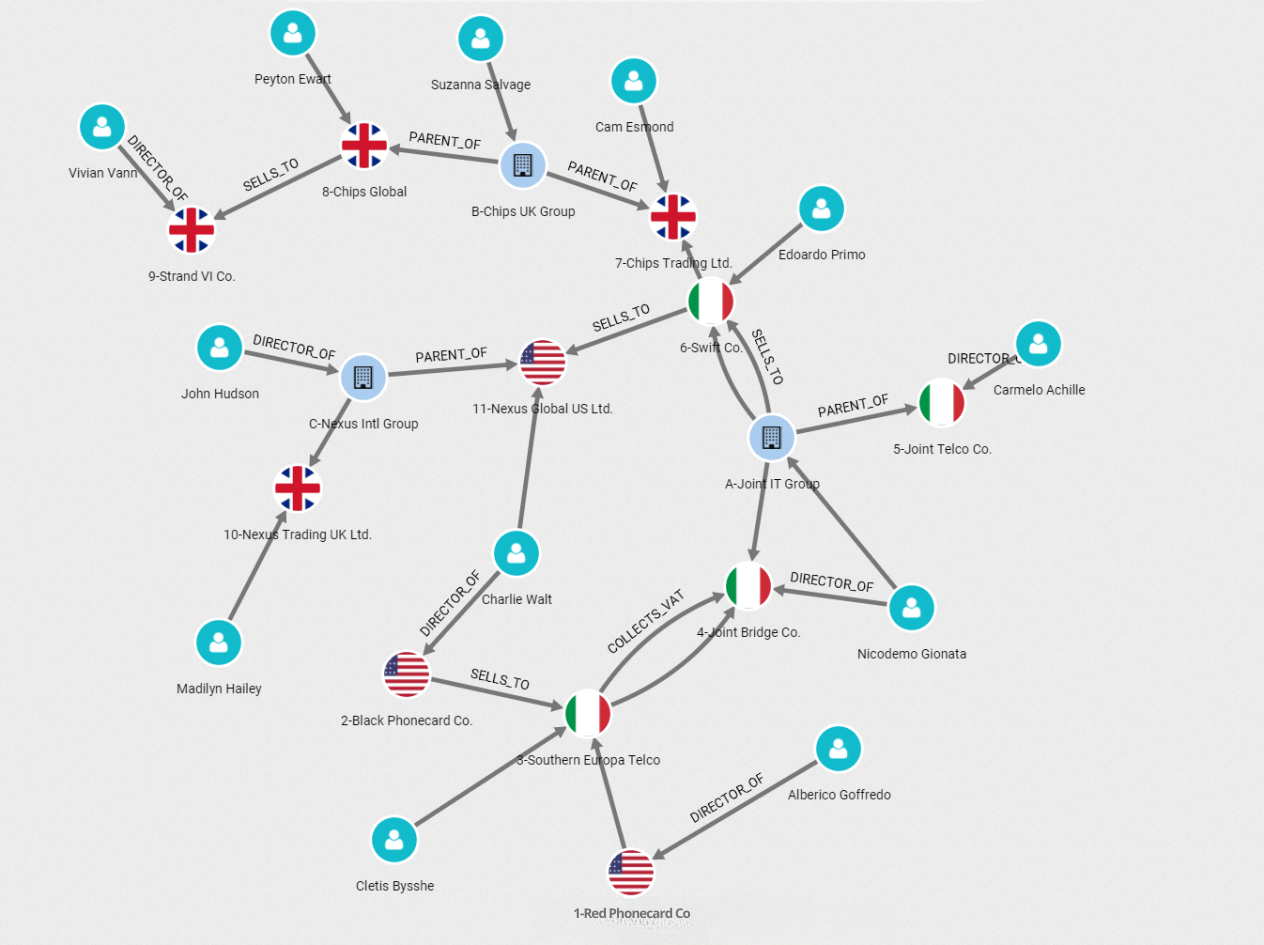
In this visualization, we’ve added the different entities the companies turned up by the initial query are connected to. We can see holding companies (nodes with flag patterns), individual companies (blue nodes), and people (turquoise nodes). The graph shows that the two original transactions are actually linked. In particular, Joint Bridge Co. controls Joint IT Group which is doing business with Swift Co. This gives us an overview of the fraud case that would be long and difficult to build by reading a text or looking at a table.
At this point, we might want to focus on the companies based in Italy.
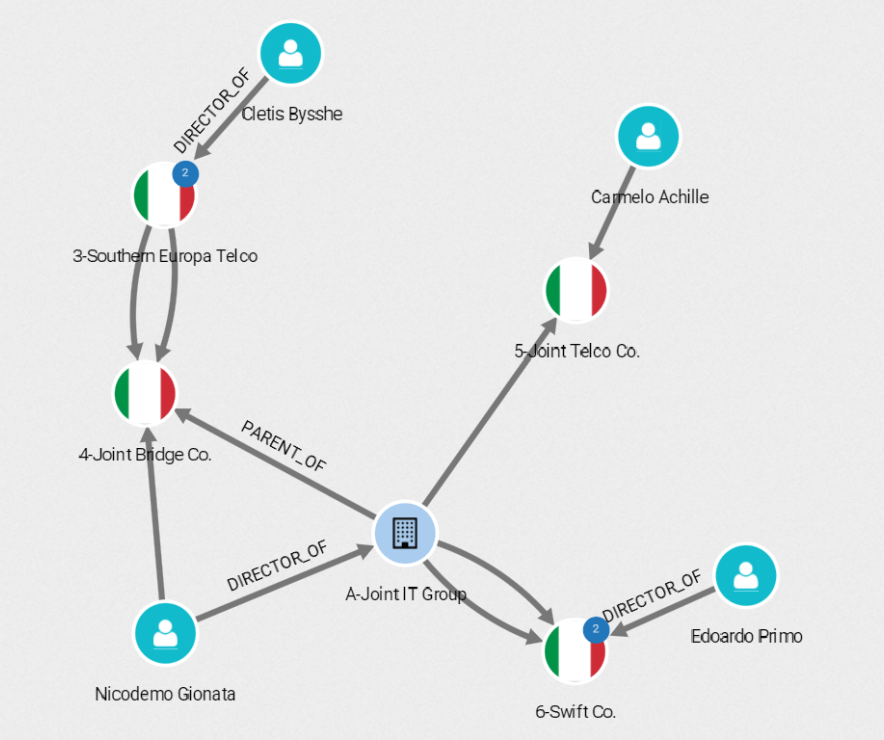
In a few clicks, we can see that the fraud seems to start with Cletis Bysshe. He is a Director of Southern Europa Telco which sold phone card rights to Joint Bridge Co. That information can be accessed by looking at the properties of the nodes and edges in the graph visualization.
A graph-native decision intelligence platform like Linkurious lets investigators surface suspicious patterns, turn them into cases, and visually investigate them seamlessly in one platform. It brings together graph analytics, advanced graph visualization, and entity resolution AI in one unified environment, designed to help analysts make faster, better-informed decisions on fraud cases.
Linkurious lets anti-fraud teams:
- Unify fragmented data into a central knowledge graph, connecting tax databases, transaction records, blacklists, and more into one coherent view.
- Analyze complex relationships across multiple hops and data sources, surfacing hidden facilitators or transaction flows that would otherwise remain invisible.
- Investigate visually, interactively, and collaboratively with intuitive tools that let users surface contextual insights around entities of interest.
- Document and share findings easily, with investigative workspaces that support annotations, case linking, and audit-ready reporting.
VAT fraud is a major problem in most countries. In the European Union, some VAT fraud rings rack up hundreds of millions of euros. In the face of such costly, complex fraud, Linkurious enables investigative teams to scale their efforts without compromising on precision.
Graph analytics and visualization is a powerful solution for detecting not only VAT fraud, but many other types of complex fraud. Read how graph analytics can speed up fraud investigations and improve fraud detection in our ebook.
Article originally published 25 March 2019. Updated on 4 September 2025.
A spotlight on graph technology directly in your inbox.