A graph algorithm is a set of instructions or a procedure designed to solve a problem or perform a task on a graph data structure. They’re useful in a wide range of applications where data is represented as a graph, and where finding patterns and relationships in that data is important. Graph algorithms solve problems like finding the shortest path or strong connections within a graph.
Graphs are used across industries, for use cases ranging from optimizing transportation or shipping networks, to drug repurposing, to detecting complex cases of fraud. They are also increasingly used as a complementary technology to improve the accuracy of AI, providing the contextual richness that intelligent systems need to excel.
We’ll introduce some common types of graph algorithms, along with specific examples of algorithms within those categories - and a few examples of how they can be used in real-world applications.
As a reminder, a graph data model consists of a collection of nodes (also called vertices) that represent individual data points. Those are connected by edges, which represent the relationships between nodes. Graph data is stored in a graph database, like Neo4j or Memgraph, which can be queried using a graph query language.
By analyzing data as a graph, it’s possible to determine the closeness of different entities, as well as how entities are connected. Graph analytics provides algorithms that help data scientists and data-driven analysts answer questions or make predictions using graph data.
Let’s take a look at those algorithms. This is not an exhaustive list, but will give you an idea of some of the most common algorithms and how they can be used across use cases.
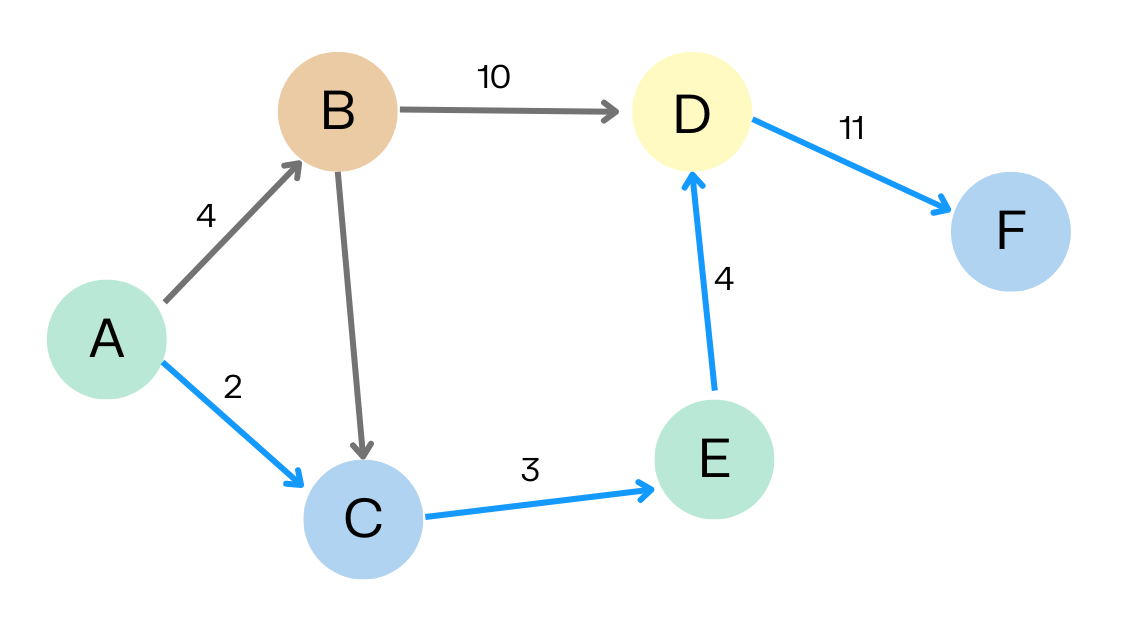
As the name suggests, shortest path algorithms help you find the shortest path between two nodes in a graph. Shortest path algorithms include:
- A*: Finds the shortest path between nodes by evaluating both the actual distance from the start and an estimated distance to the goal. It is more sophisticated than the similar Dijkstra’s algorithm.
- Minimum Weight Spanning Tree: Finds a subset of edges that connects all nodes in the graph with the minimum possible total edge weight.
- All Pairs Shortest Path: Algorithms like Floyd-Warshall that compute the shortest paths between every pair of vertices in a graph.
Applied to real-world use cases, these algorithms can be used for:
- Supply chain logistics: finding the shortest route for deliveries, minimizing travel time for shipments, and more.
- Network routing: routing packets in a computer network, finding the shortest path between two nodes in a network.
- Transportation: Optimizing transportation systems, including scheduling public transportation routes and managing traffic flow.
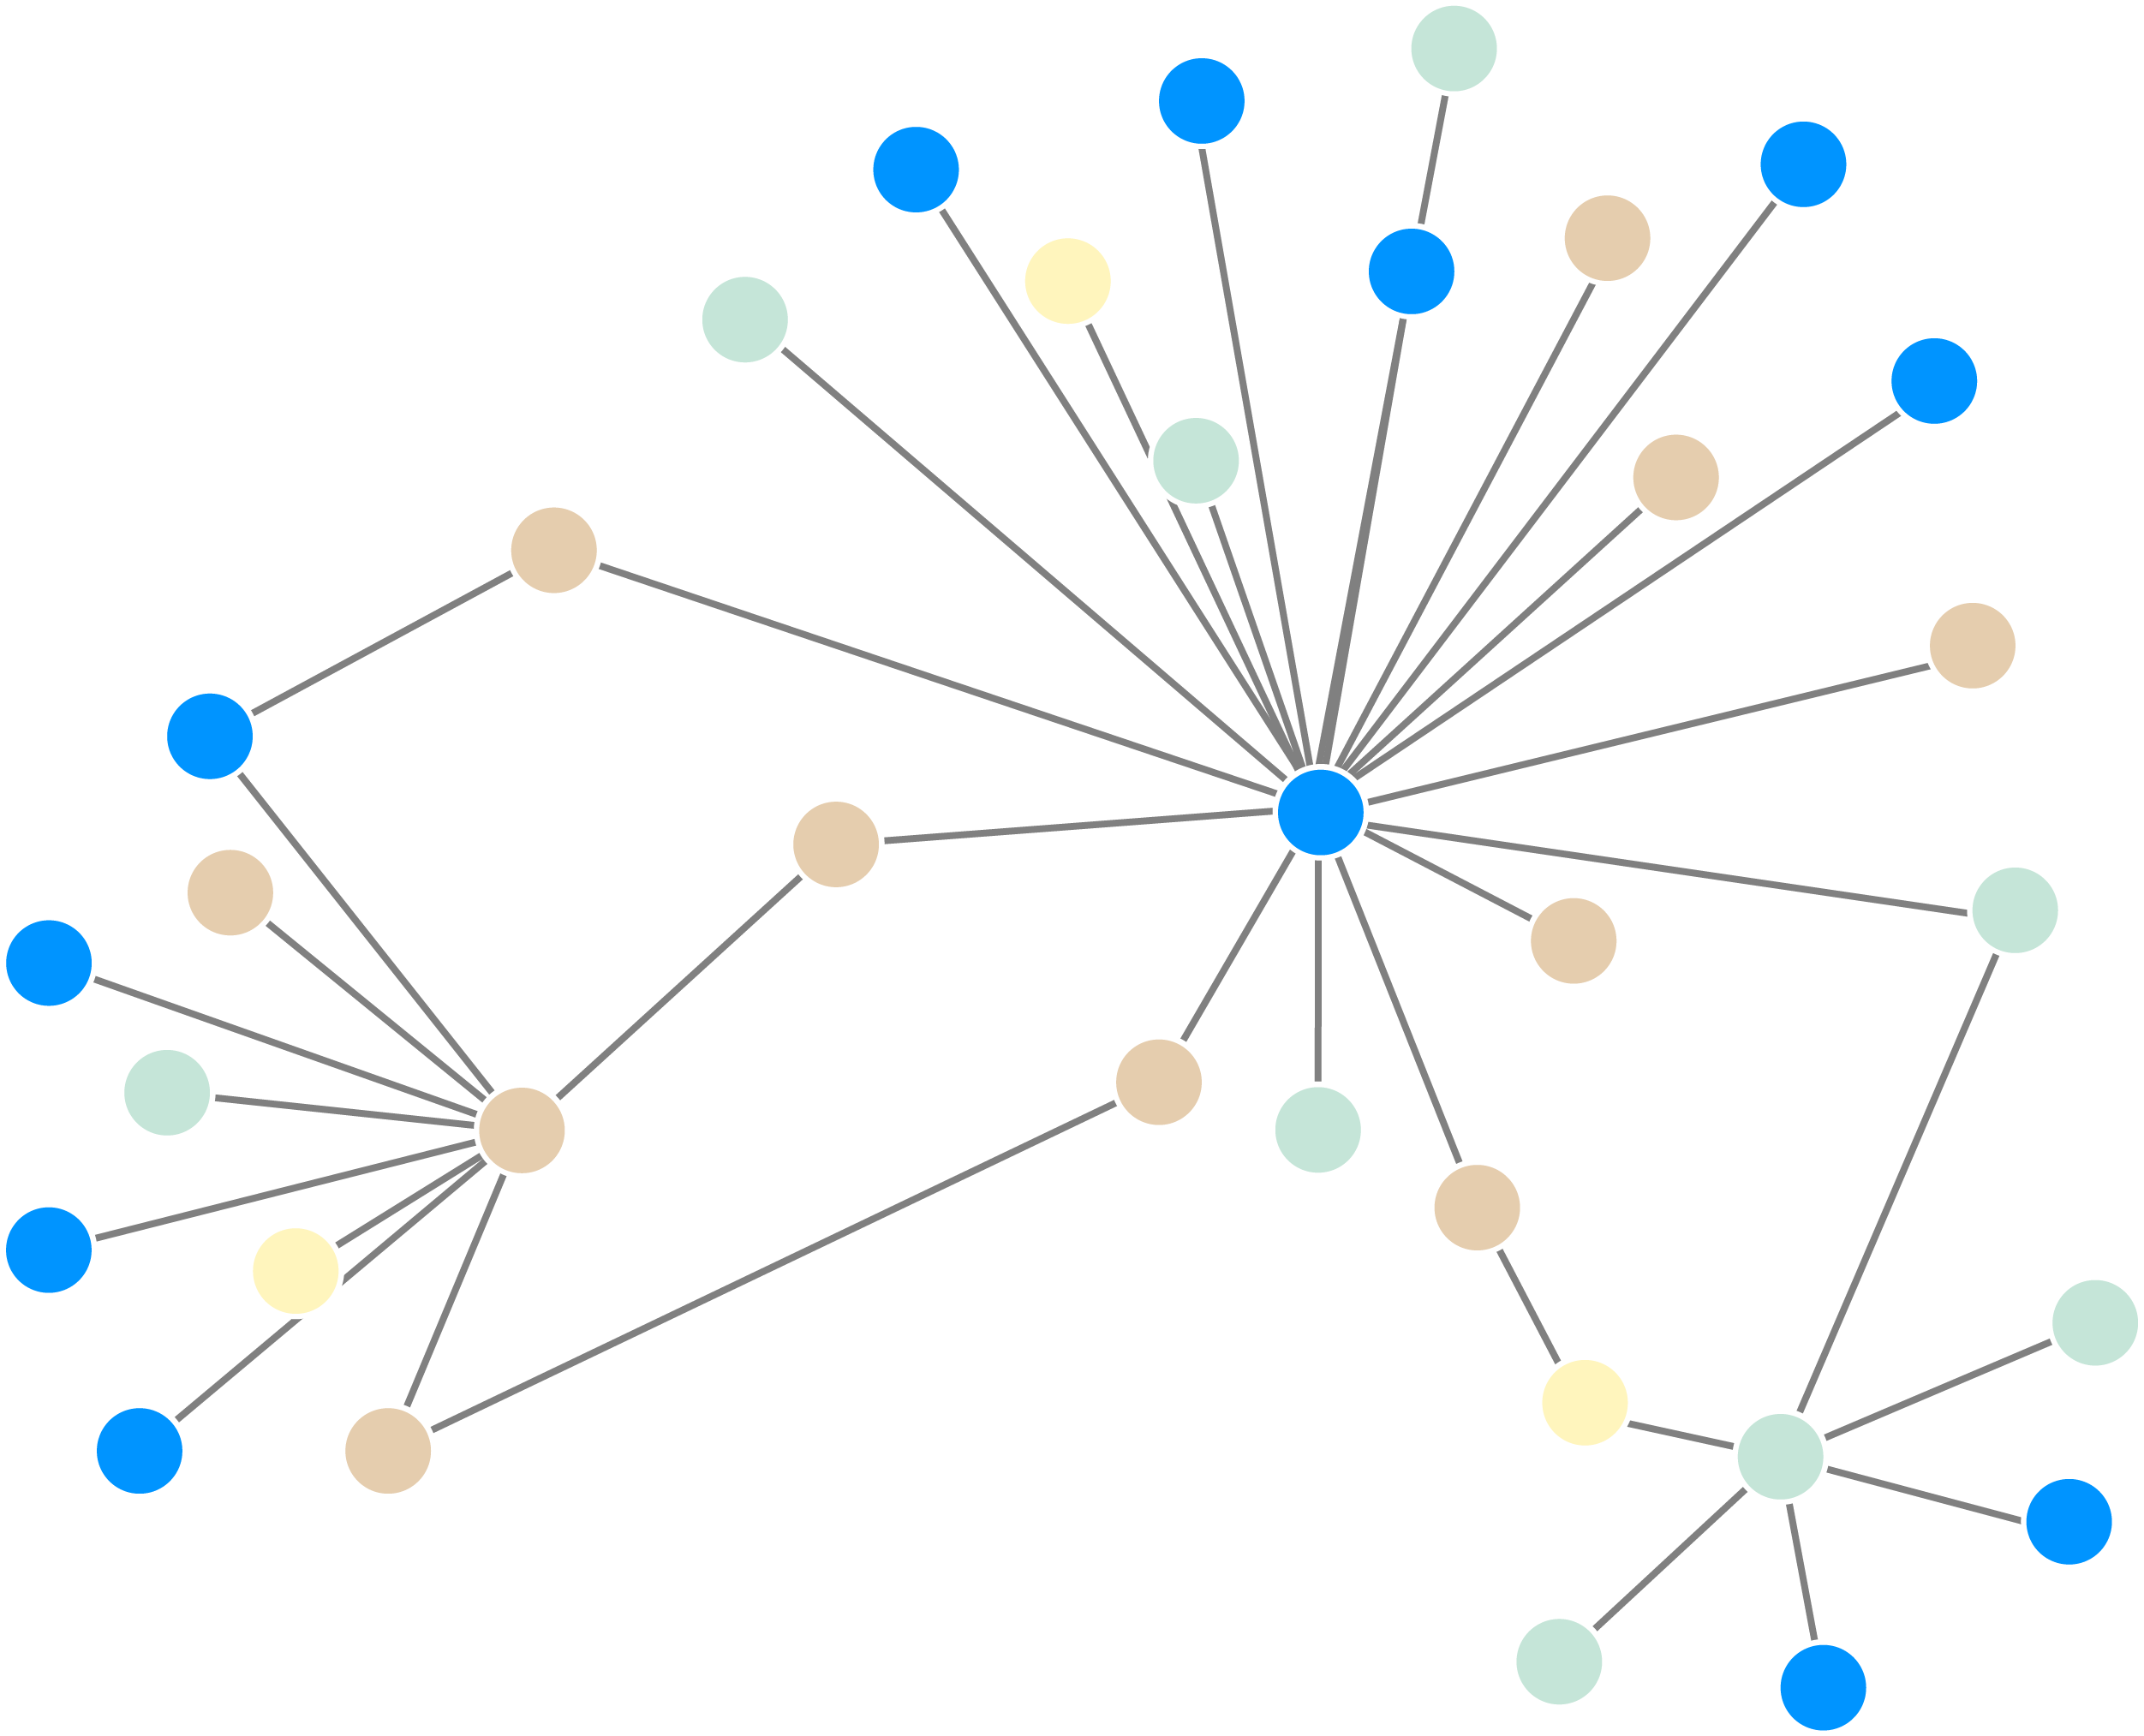
Centrality algorithms are used to identify the most important nodes in a graph based on their connectivity and influence within the graph. They can help identify influential individuals within a network, or where the gatekeepers lie in a particular group. Examples of centrality analysis algorithms include:
- PageRank: Ranks nodes based on the structure of incoming links, originally developed by Google to rank web pages by assigning higher importance to nodes that receive links from other important nodes.
- Eigenvector Centrality: A measure of node influence that assigns scores based on the principle that connections to high-scoring nodes contribute more to a node's score than connections to low-scoring nodes.
- Betweenness Centrality: Quantifies how often a node lies on the shortest path between other nodes, identifying bridge nodes that control information flow within a network.
- Degree Centrality: A simple centrality measure that counts the number of connections each node has, with higher values indicating nodes that are directly connected to many others.
Applications of centrality algorithms include:
- Financial crime: identifying the ringleader in a network of fraudsters.
- Epidemiology: identifying highly connected individuals in a network who may be likely to spread a disease.
- Social network analysis: identifying important individuals in a social network such as influencers or gatekeepers.
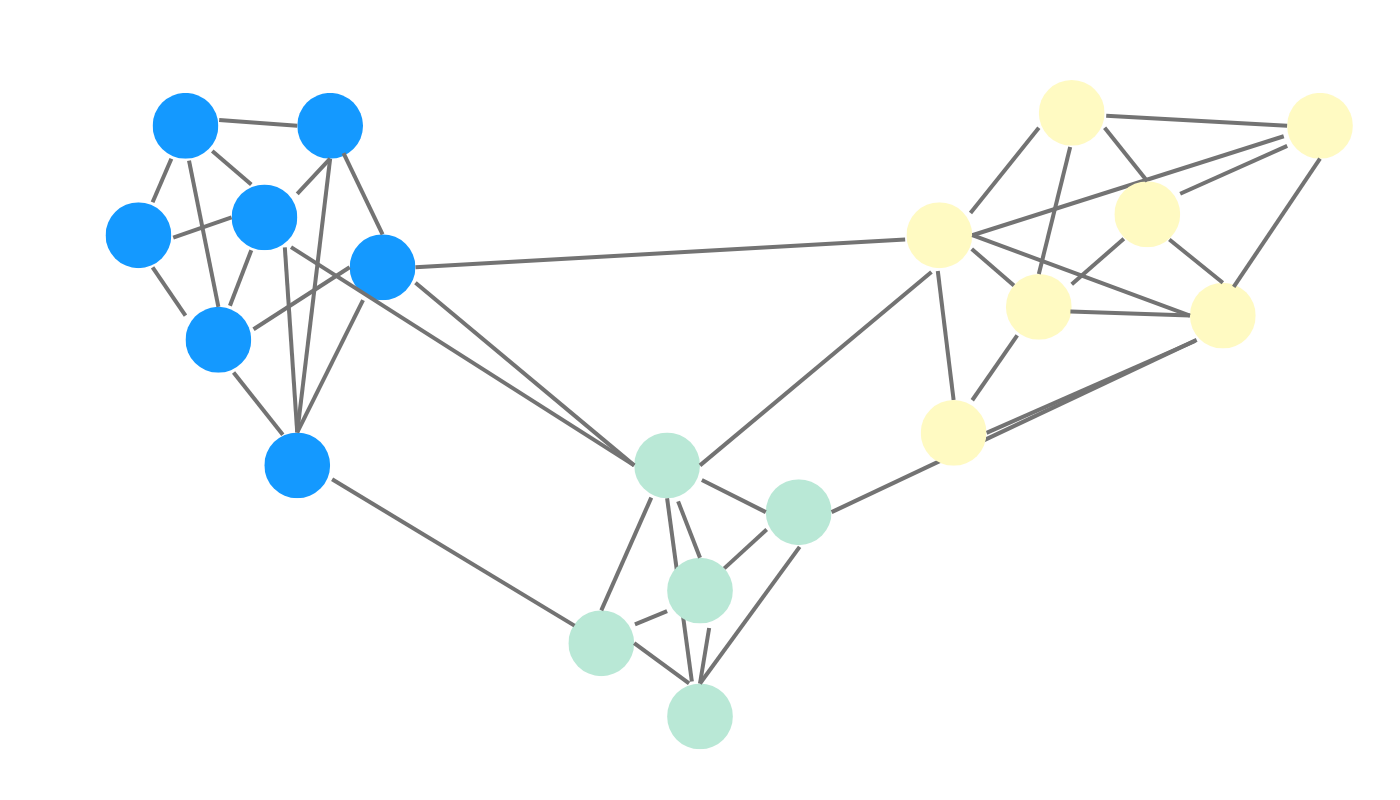
Community detection algorithms are used to identify groups of nodes in a graph that are more densely connected to each other than to the rest of the graph. These groups are often called communities or clusters, and can represent groups of individuals with similar interests, regions with similar climate patterns, or subtopics within a larger topic. Examples of community detection algorithms include:
- Louvain algorithm: Detects small communities in large networks, maximizing a modularity score for each community.
- Label Propagation: A fast, near-linear time algorithm for finding communities where nodes adopt the label that most of their neighbors currently have.
- Weakly Connected Components: Identifies maximal subgraphs where any node can reach any other node when edge directions are ignored.
Applications of community detection algorithms include:
- Recommendation systems: identifying groups of users with similar interests and recommending products or services to users based on the preferences of others within their community.
- Bioinformatics: identifying groups of genes that are co-regulated, or groups of proteins that interact with each other in a cell.
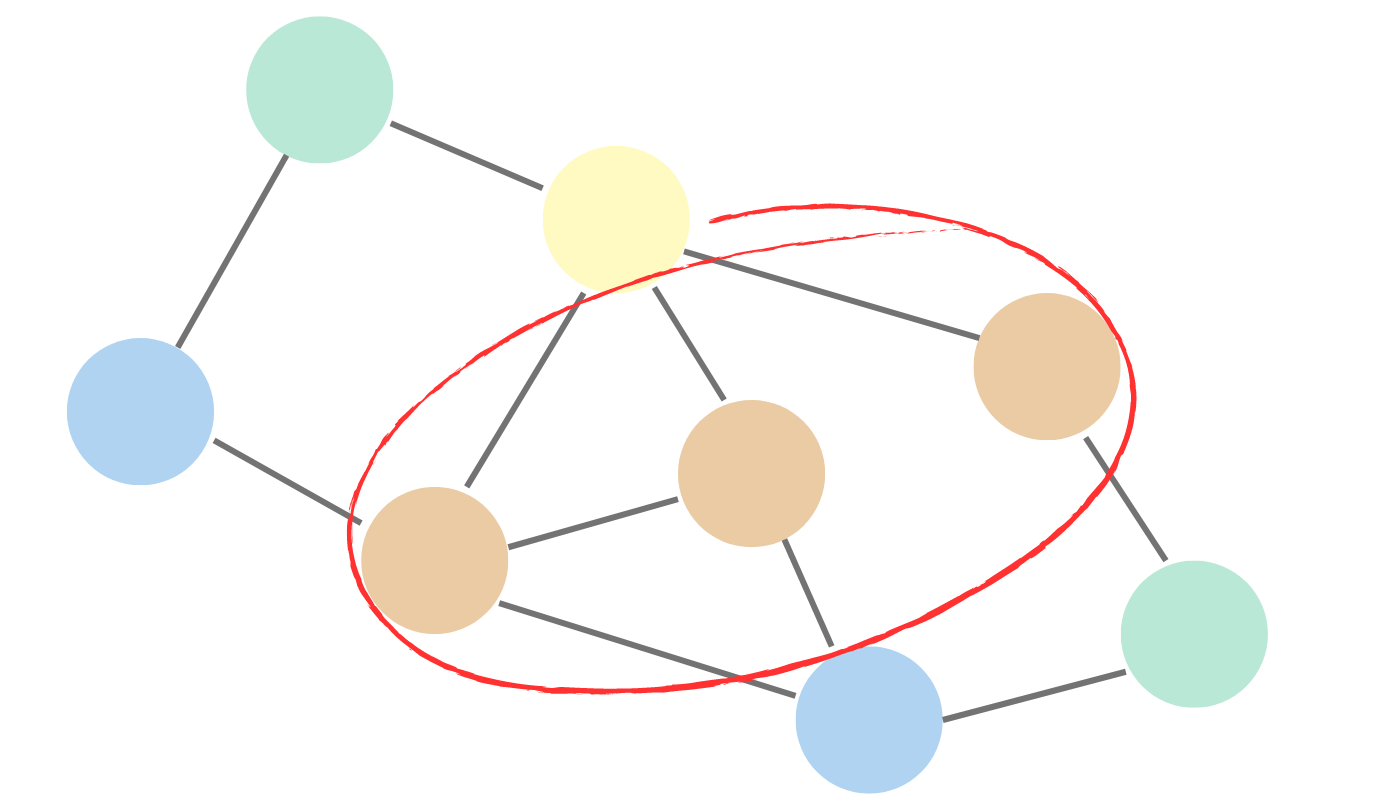
Similarity algorithms are used to identify nodes that are similar to each other based on measures such as distance or correlation. These algorithms are often used in data analysis tasks where the goal is to identify patterns or clusters in the data. Examples of similarity analysis algorithms include:
- K-Nearest Neighbors: A classification algorithm that identifies the k nodes most similar to a target node based on selected features or distance metrics.
- Jaccard Similarity: A statistic used to gauge the similarity between sets by measuring the ratio of the intersection size to the union size, often applied to compare nodes based on their neighbors.
- Cosine Similarity: A metric that measures the cosine of the angle between two vectors, determining how similar they are.
Similarity algorithms can be applied to:
- Anomaly detection: identification of unusual patterns in the data that may indicate fraud or other unusual behavior.
- Natural language processing: identification of similar words or documents based on semantic or syntactic features, such as word frequency or word embeddings.
- Recommendation systems: identifying similar products or services based on the preferences of other users to make personalized recommendations.
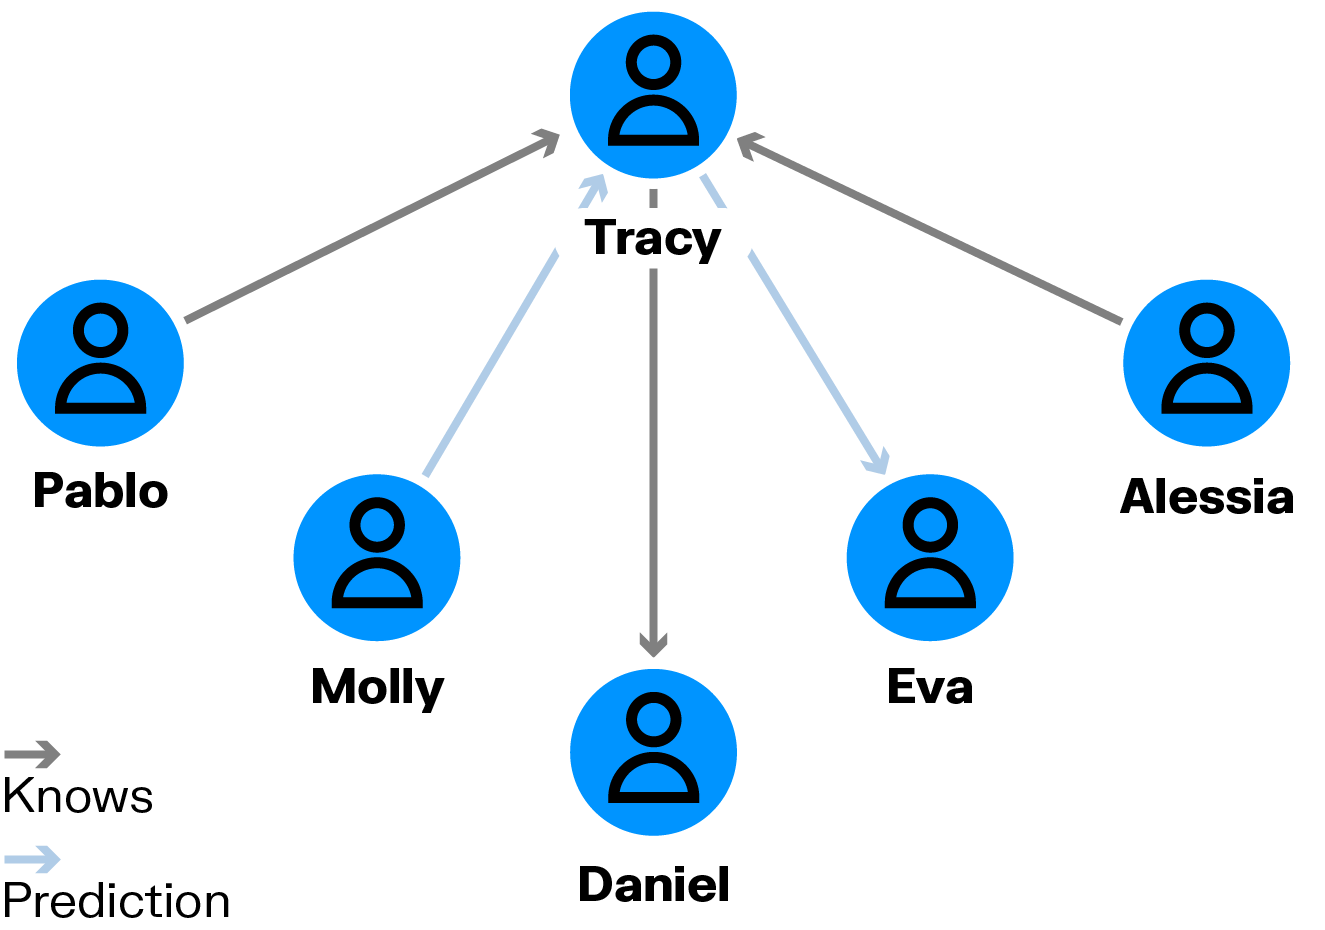
Link prediction algorithms are used to predict the likelihood of a link or edge forming between two nodes in a graph. They can be used to predict how likely two individuals are to know each other based on their relationships with other individuals. Examples of link prediction algorithms include:
- Common neighbor: Counts the number of neighbors that two nodes have in common, with higher counts suggesting a higher likelihood of connection.
- Adamic Adar: refines common neighbor counting by giving more weight to neighbors that are less connected overall, based on the principle that rarer connections are more significant indicators of similarity.
Link prediction can be applied to use cases such as:
- Cybersecurity: identification of potential cyber attacks or security breaches by predicting connections between nodes that may be used to exploit vulnerabilities in the system.
- Biological networks: predicting protein-protein interactions, gene regulation networks, or other biological networks.
- Transportation: predicting traffic patterns and optimizing transportation routes based on those predictions.
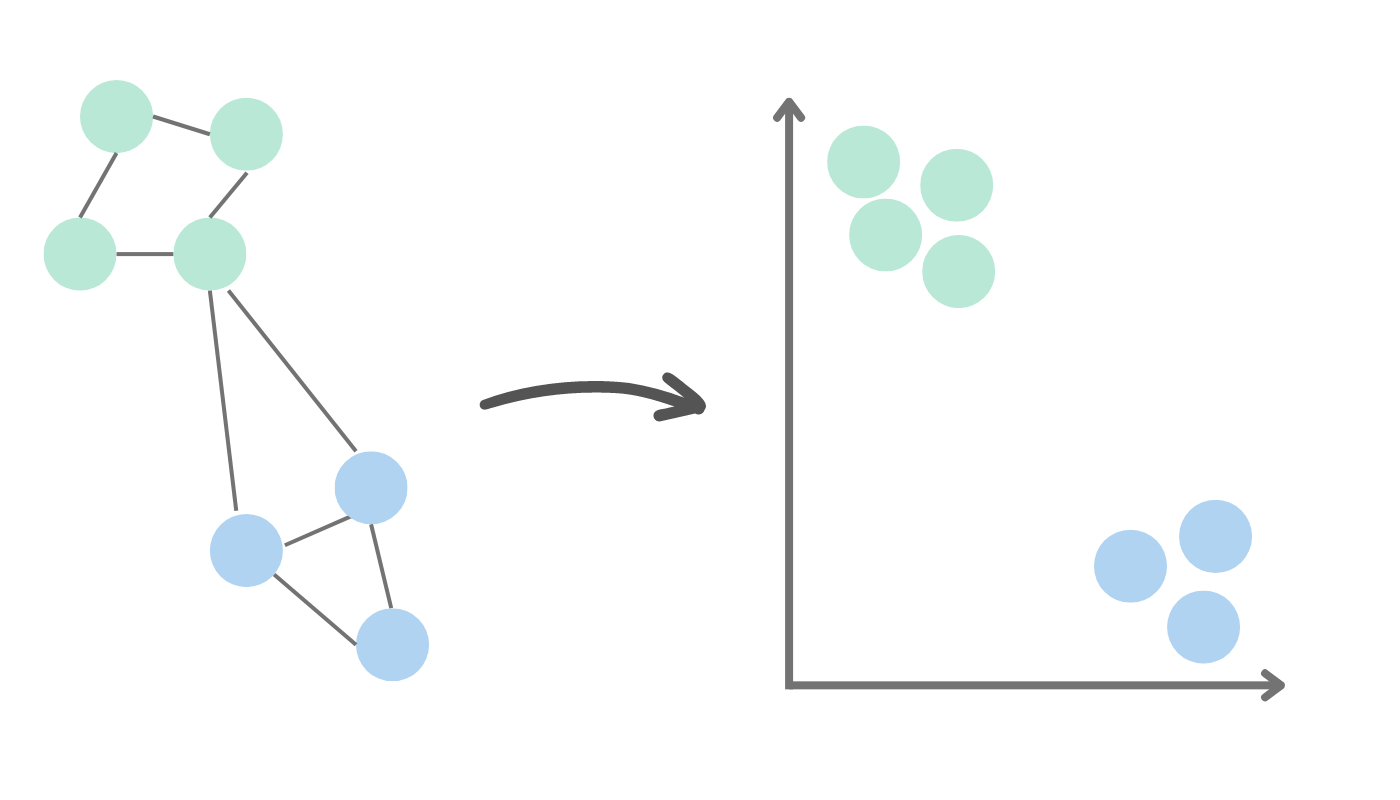
Graph embedding algorithms compute vector representations of nodes in a graph. They can be used in machine learning models. They can also be used in situations where the graph is too large or complex to analyze directly, extracting meaningful representations of the nodes for downstream analysis. Examples of these algorithms include:
- GraphSAGE: A neural network framework for inductive representation learning that generates embeddings by sampling and aggregating features from a node's local neighborhood.
- Node2Vec: An algorithmic framework that produces continuous feature representations for nodes by optimizing a neighborhood-preserving objective using biased random walks.
Graph embeddings can be applied to use cases including:
- Network visualization: visualizing the structure of a graph in a low-dimensional space, making it easier to explore and understand the relationships between the nodes.
- Anomaly detection: flagging unusual patterns in the data that could indicate financial crime or other suspicious behavior.
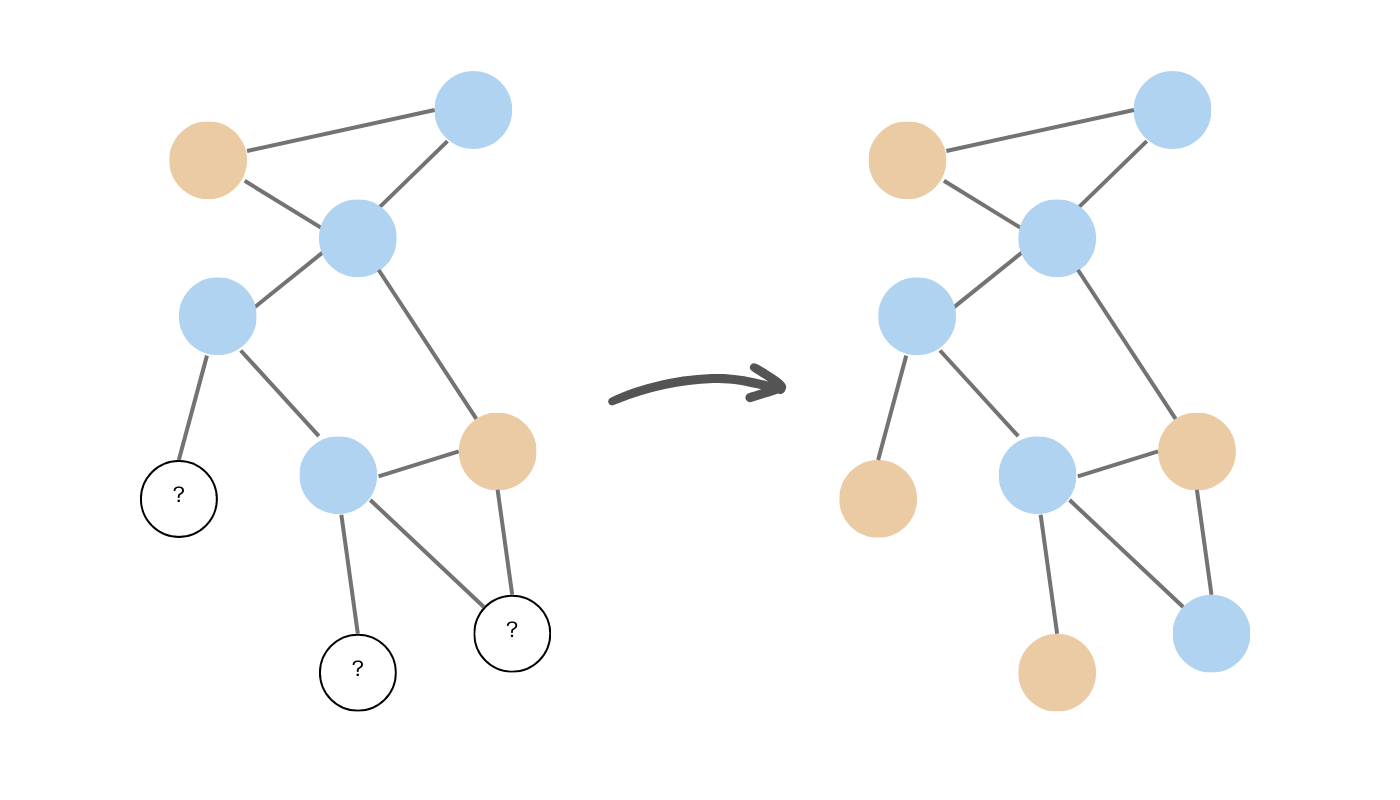
Node classification algorithms are used to assign a label or category to each node in a graph based on the attributes of the node as well as its neighboring nodes. This is a type of supervised learning where the goal is to learn a model that can accurately predict the node label. Examples of node classification algorithms include:
- Random walk algorithms: These algorithms traverse a graph by randomly moving from node to node along edges, forming the basis for many node ranking and community detection techniques.
- Label propagation algorithms: Iterative algorithms where nodes adopt the most frequent label among their neighbors, enabling fast community detection and semi-supervised learning on graphs.
These algorithms can be applied to use cases that include:
- Fraud detection: detecting fraudulent activity in a network based on the behaviors and connections of the individuals in the network.
- Social network analysis: predicting the attributes or behaviors of individuals in a social network based on those of their social connections.
This article is just a brief overview of some of the many graph algorithms out there - but it already gives you a taste of the power and flexibility of graph analytics.
As a next step, learn how you can visualize your graph data as a network to gain insights faster and easily share those insights with fellow analysts, key decision makers, or other stakeholders.
Linkurious is a software company providing technical and non technical users alike with the next generation of detection and investigation solutions powered by graph technology. Simply powerful and powerfully simple, Linkurious Enterprise helps more than 3000 data-driven analysts or investigators globally in Global 2000 companies, governmental agencies, and non-profit organizations to swiftly and accurately find insights otherwise hidden in complex connected data so they can make more informed decisions, faster.