Fraud remains a persistent and growing challenge for financial institutions and public organizations. Recent industry research shows that attempted fraud continues to rise: nearly 60% of companies report higher fraud losses in 2025, increasing pressure to detect complex, interconnected schemes earlier and more accurately.
Many fraud cases today are not isolated incidents. Identities reappear with slight variations, signals overlap across channels, and the same infrastructure is reused across attempts. Investigation teams increasingly face sophisticated fraud schemes involving clusters of related activity that evolve over time.
Easy access to new technology reinforces this shift. A large majority of decision-makers report seeing more financial crime involving AI technologies, most often tied to synthetic identity creation. AI-assisted techniques make it easier to generate plausible identities, test them across systems, and reuse data at scale.
For anti-fraud teams, this dynamic is often described as an arms race. As controls improve, fraudsters adapt. The challenge is no longer just spotting suspicious activity, but understanding how seemingly separate cases connect.
Graph analytics address this challenge by focusing on relationships rather than individual records. They make it possible to analyze connected data at scale and surface patterns that are difficult to detect when information is spread across tables, alerts, and systems. In this article, we explore common fraud scenarios where this approach proves useful.
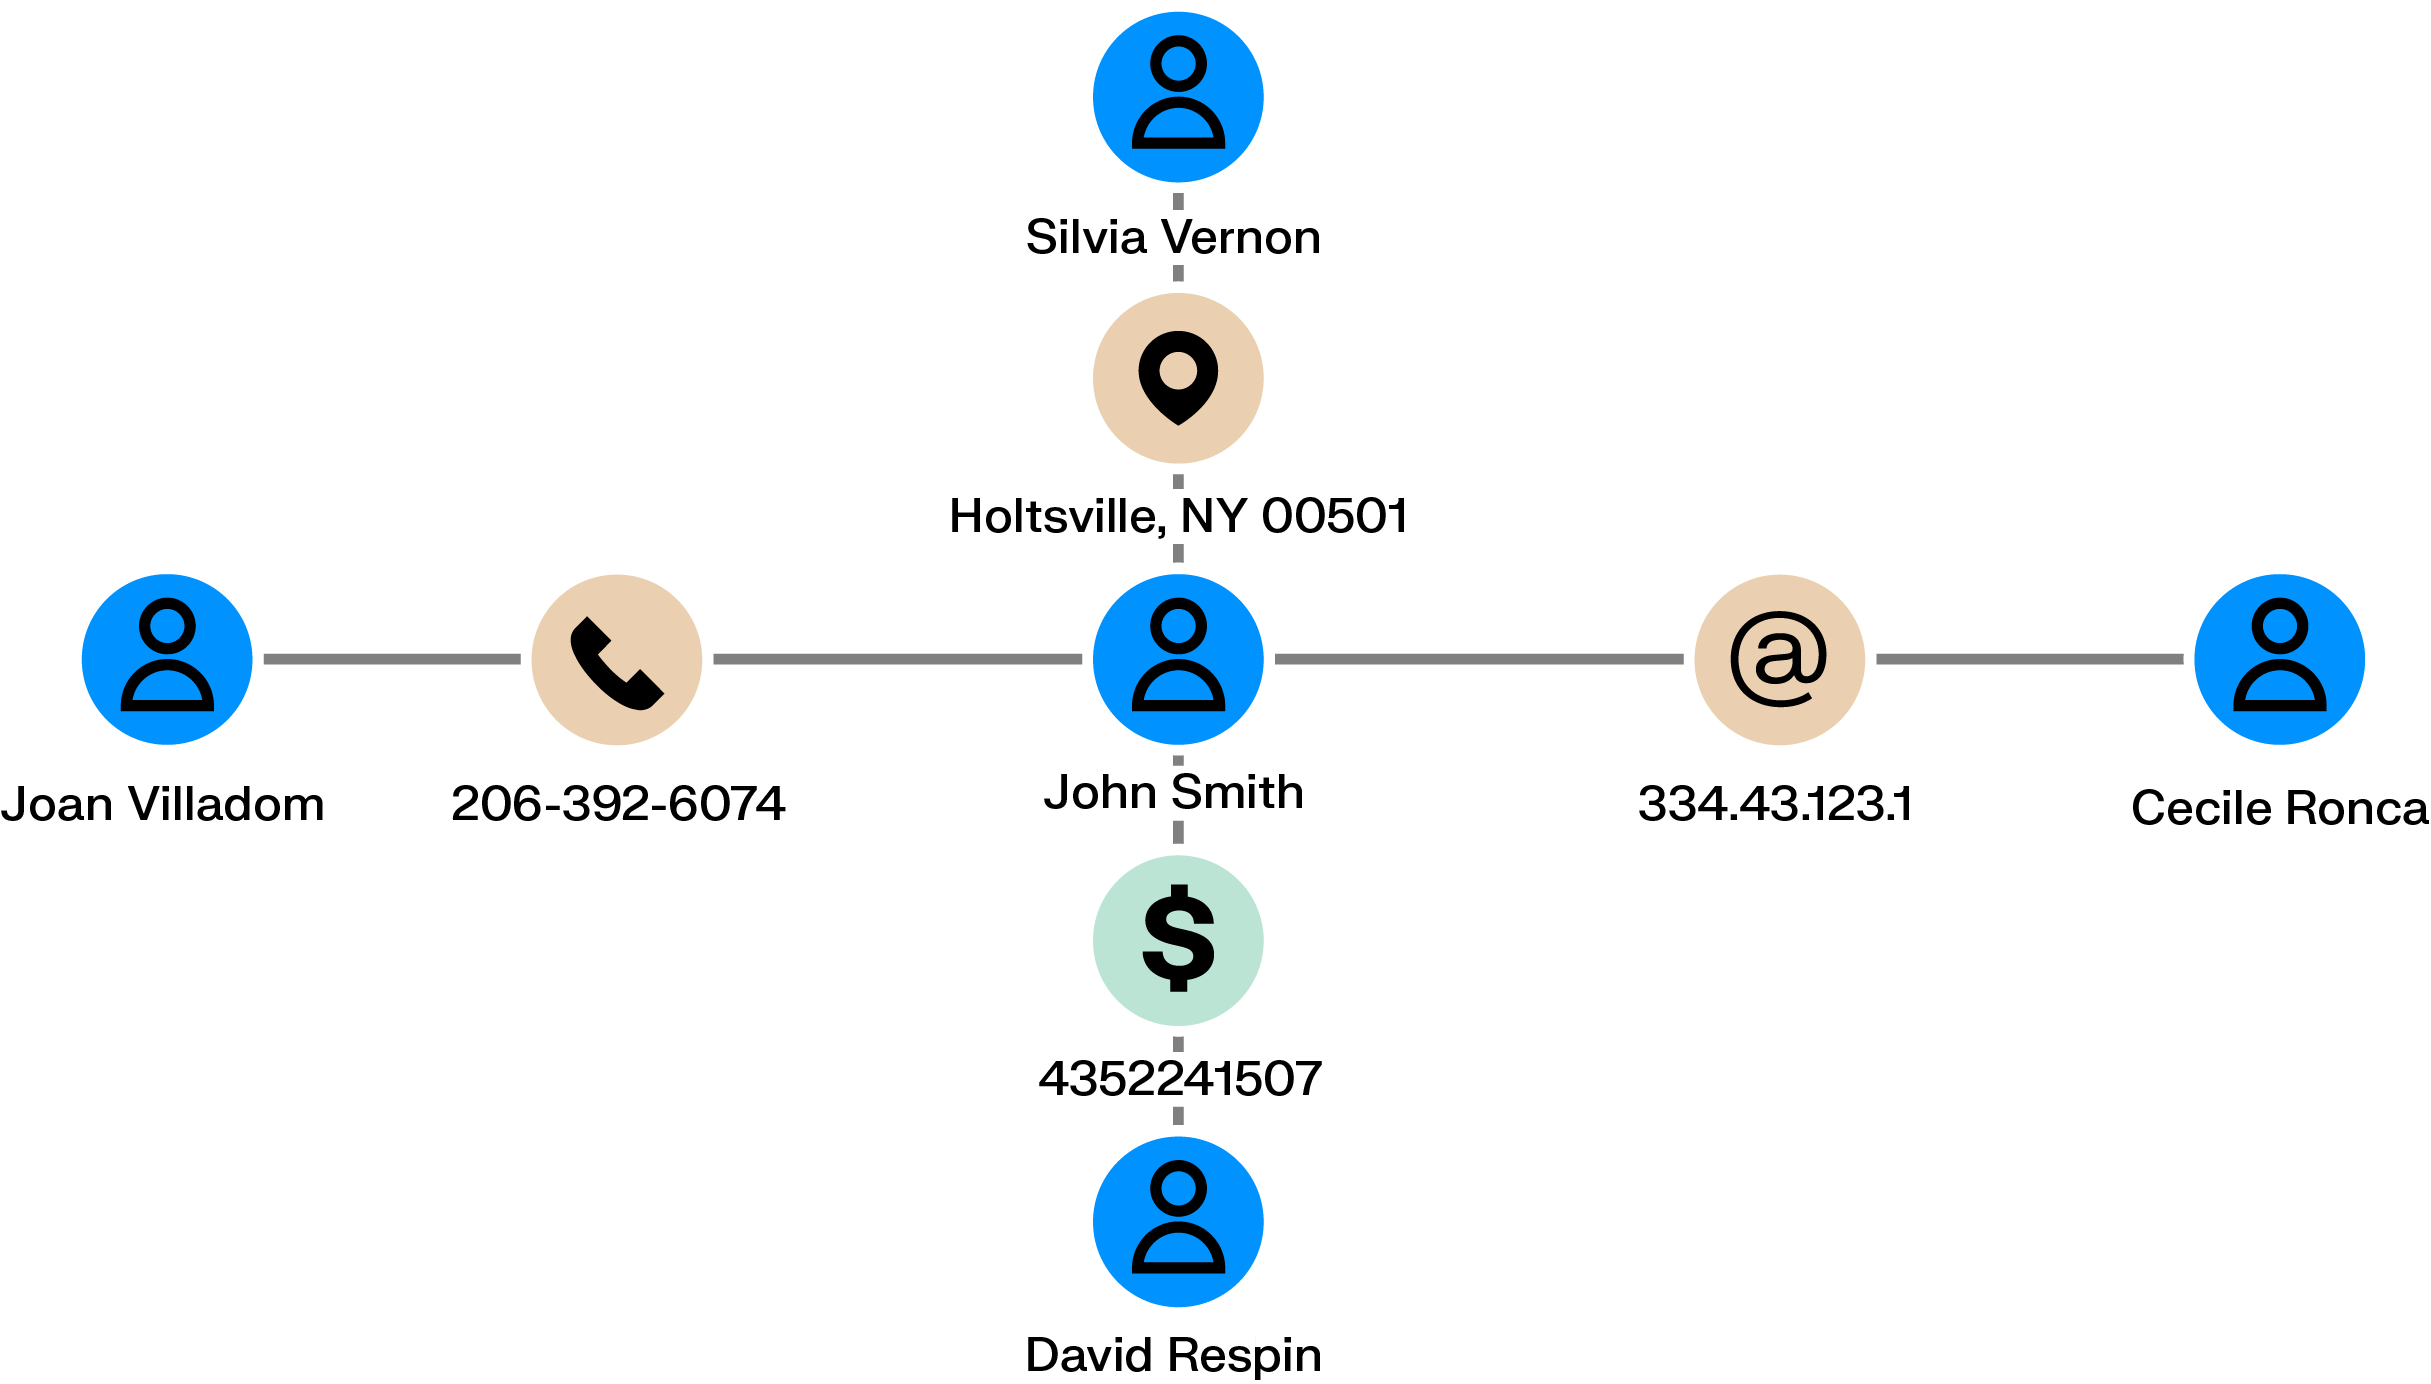
Graph analytics model data as entities and relationships rather than isolated records. Entities can represent people, accounts, devices, companies, or transactions, while relationships describe how they are connected, such as money moving between accounts or multiple identities sharing the same contact details.
By focusing on these connections, graph analytics and visualization help reveal patterns that are difficult to detect when data is reviewed in isolation. Graph analytics support fraud detection by making it possible to:
- Analyze direct and indirect relationships across people, accounts, and transactions.
- Identify reused identifiers such as phone numbers, addresses, devices, or bank accounts
- Detect recurring patterns across separate cases
- Expose coordinated activity earlier in the investigation process
In the following examples, you can see applications of graph analytics for various fraud detection and investigation scenarios.
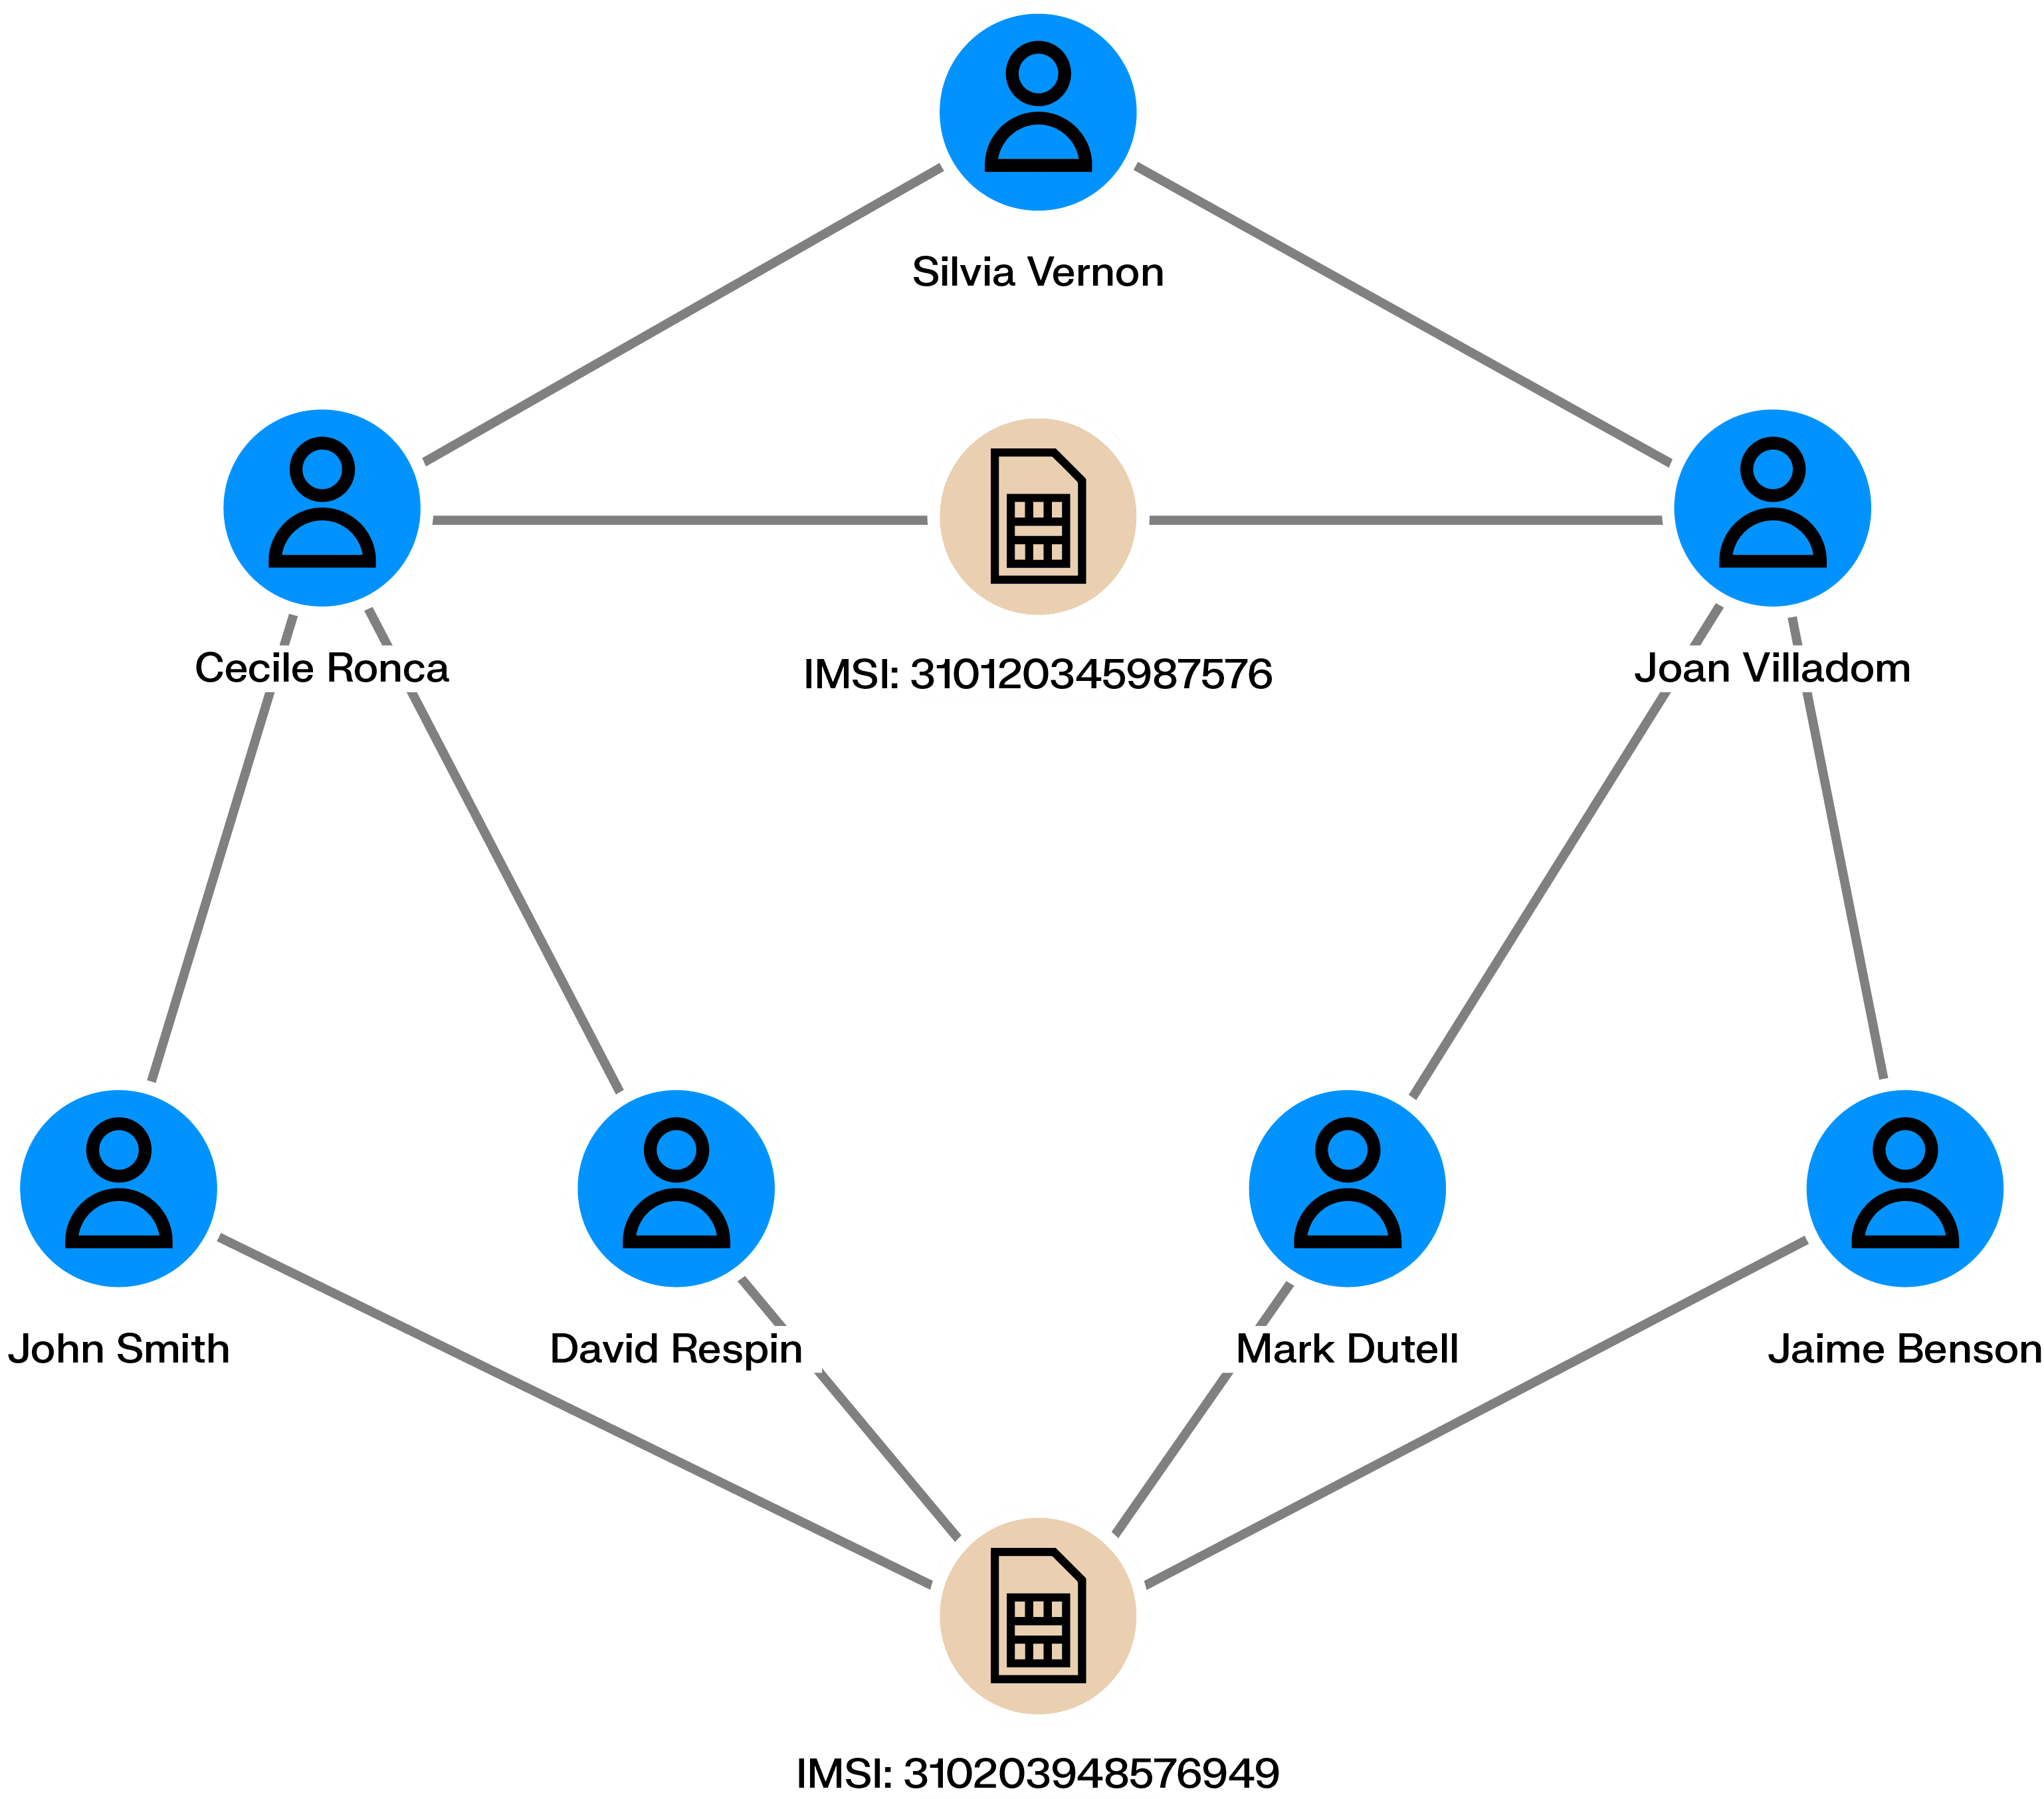
When criminals attempt to defraud a bank or launder money, they often try to obscure their activity. One common tactic is the creation of fake identities. A synthetic identity combines real and fabricated information, such as a valid social security number paired with a fictitious name, and does not correspond to a single real person. Detecting these identities early can help prevent downstream financial crime.
Graph analytics can identify groups of clients interconnected through shared personal data, such as addresses, phone numbers, dates of birth, or IP addresses. These shared attributes often point to synthetic identities controlled by the same individual or group.
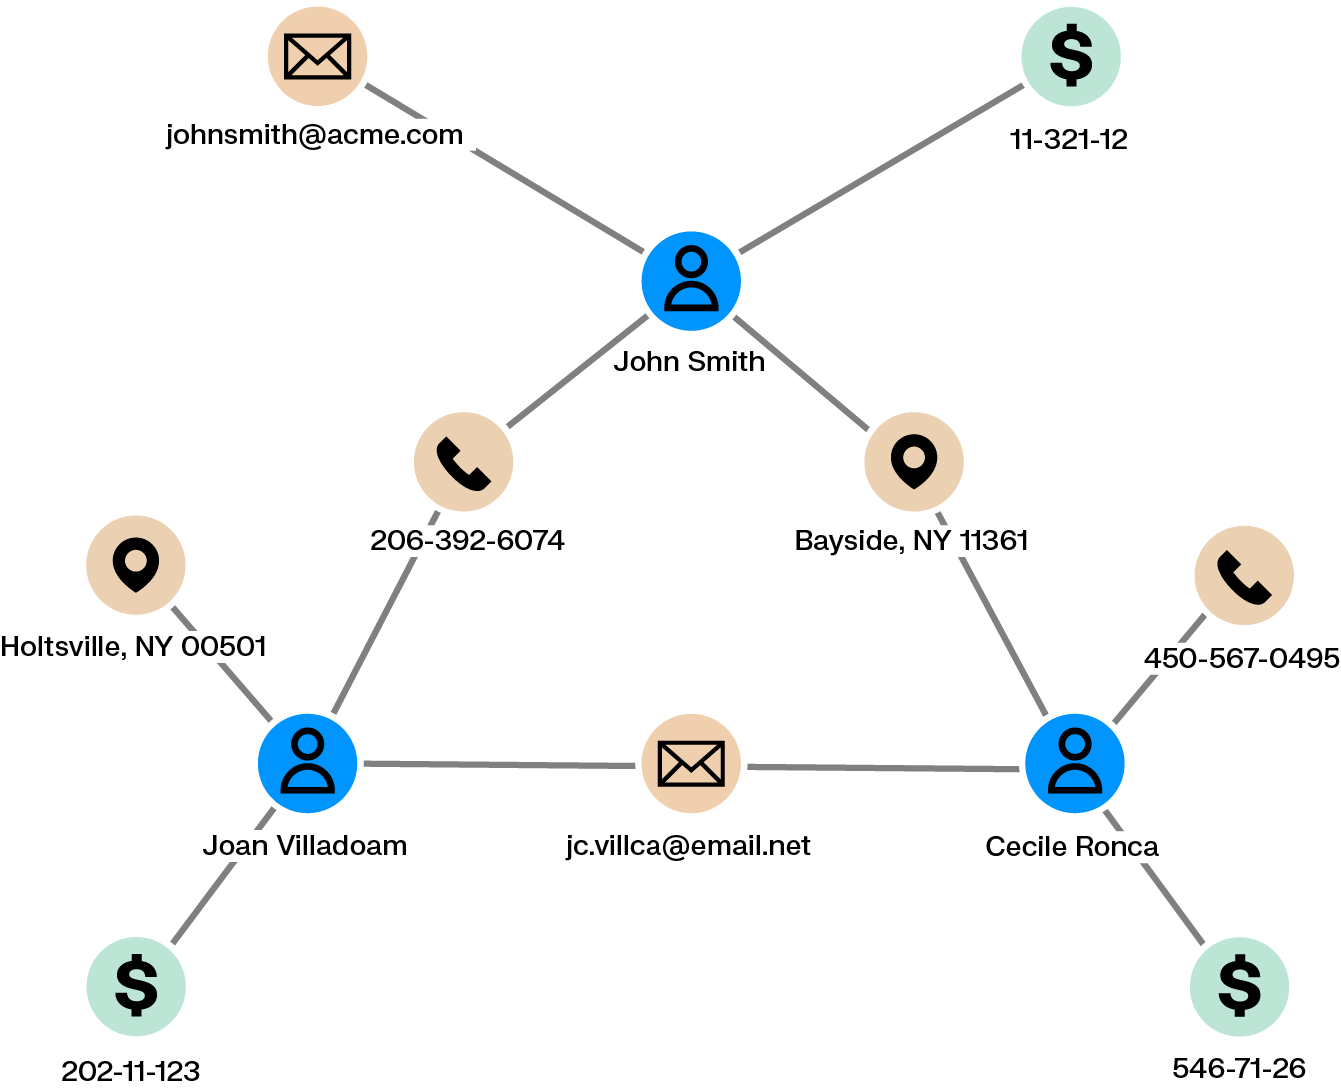
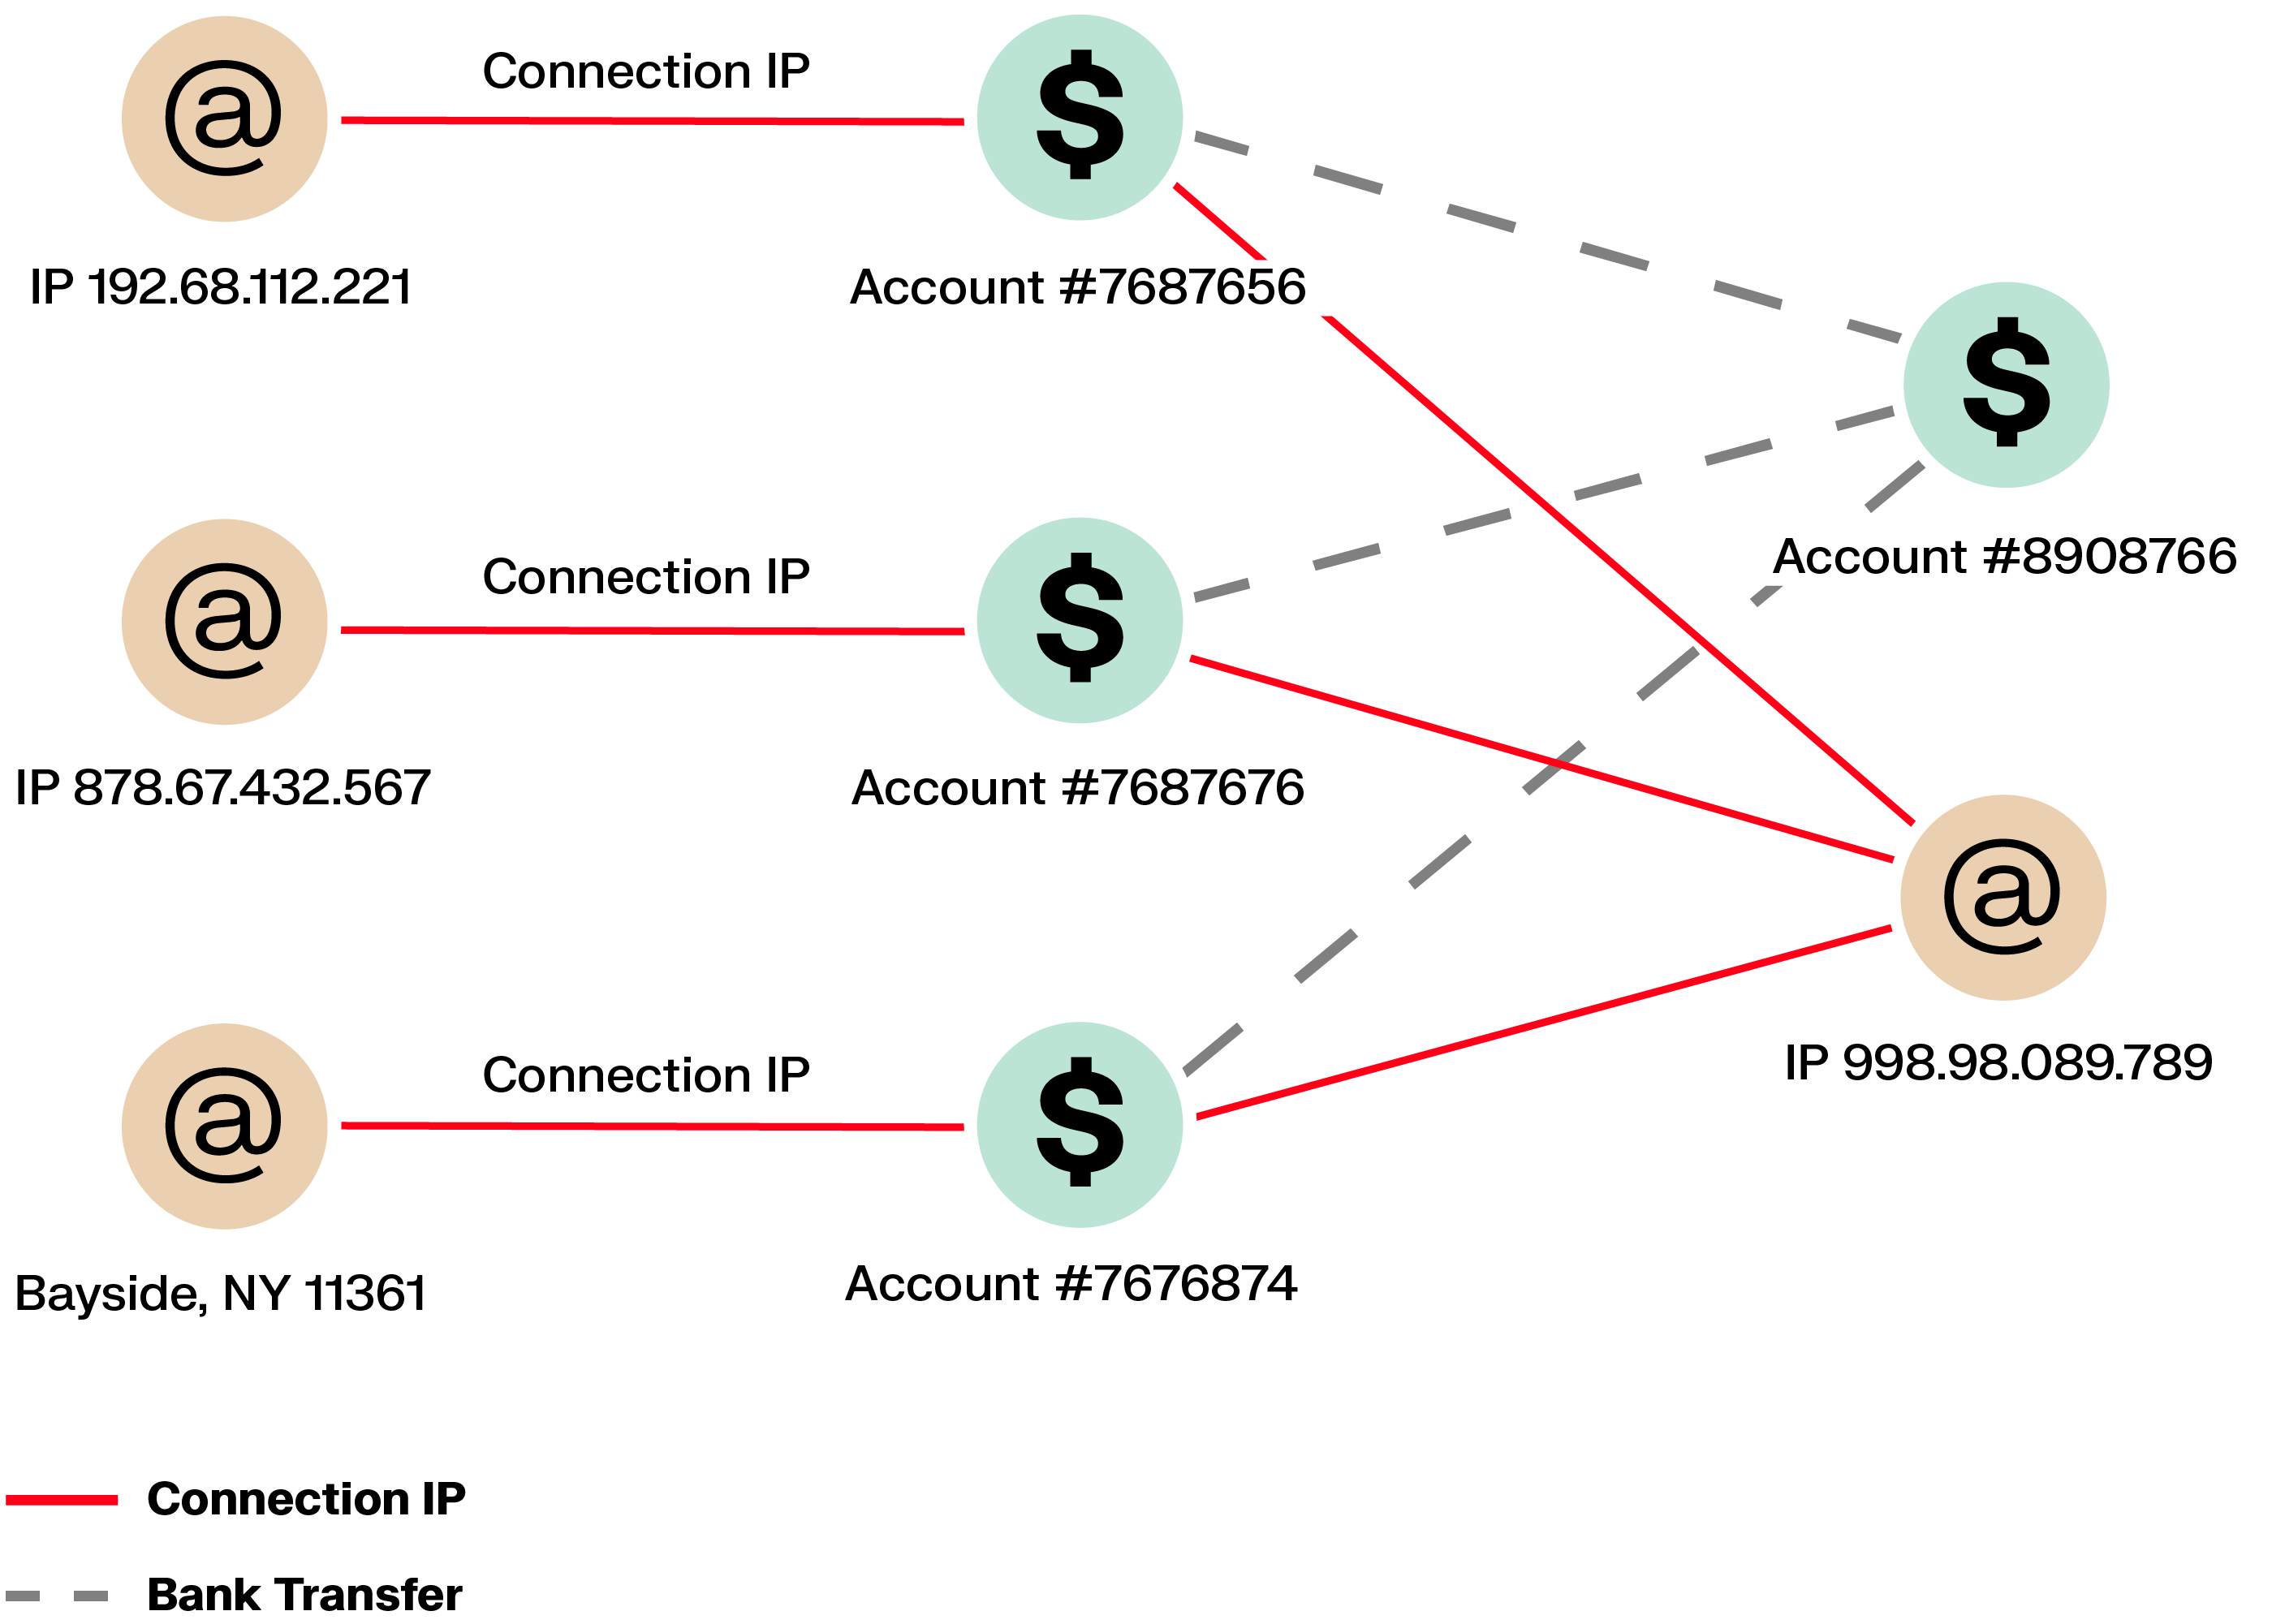
Fraud detection systems or external tips may flag a client or behavior as suspicious. A key question for investigators is whether the activity is isolated or part of a broader scheme. Answering this requires exploring what the client or behavior is connected to, both directly and indirectly. When data is spread across multiple systems and interfaces, this process can be slow and difficult.
Graph analytics support dynamic exploration of relationships within large and heterogeneous datasets. Investigators can visualize how a client is connected to others through transactions, contact details, or shared identifiers, making it easier to identify accomplices and related activity.
Money mule networks act as the connective tissue of many fraud schemes. Seemingly unrelated individuals receive and pass funds through a series of accounts, helping criminals distance themselves from the original theft. Each transfer may look routine on its own, which allows these networks to operate quietly until losses have already spread across multiple accounts.
Graph analytics make these networks visible. By mapping chains of transfers and shared financial relationships across accounts, devices, and identifiers, investigators can follow the movement of funds, spot the accounts that link different parts of the network, and intervene before the scheme grows further.
Some fraud networks exploit unemployment or social benefits systems by reusing legitimate employment documents with small modifications. These documents are used to submit claims on behalf of multiple individuals, who may keep a portion of the funds while sharing the rest with organizers.
Because these schemes rely on reused information, links naturally emerge between participants. Fraudsters may be connected through the same employer, phone numbers, addresses, bank accounts, or IP addresses, which graph analytics can surface.
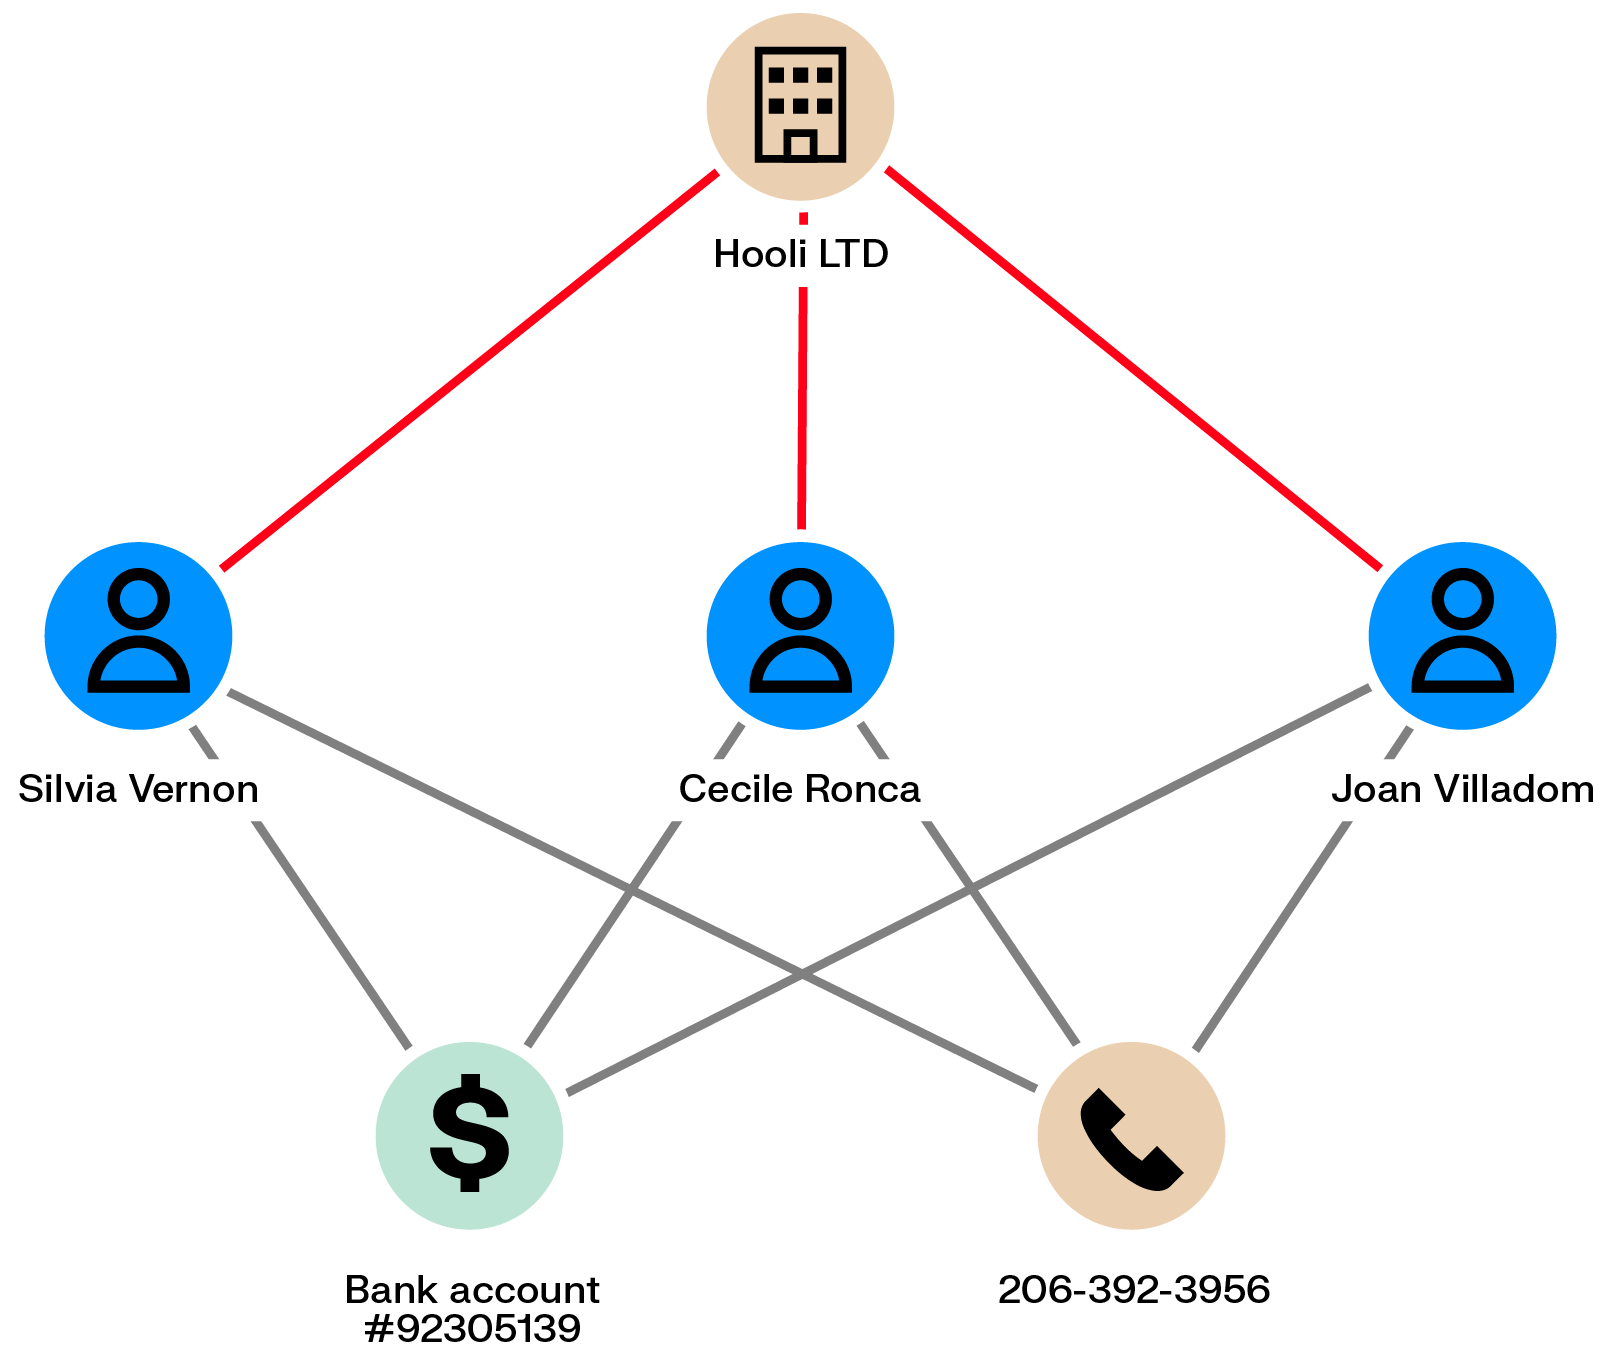
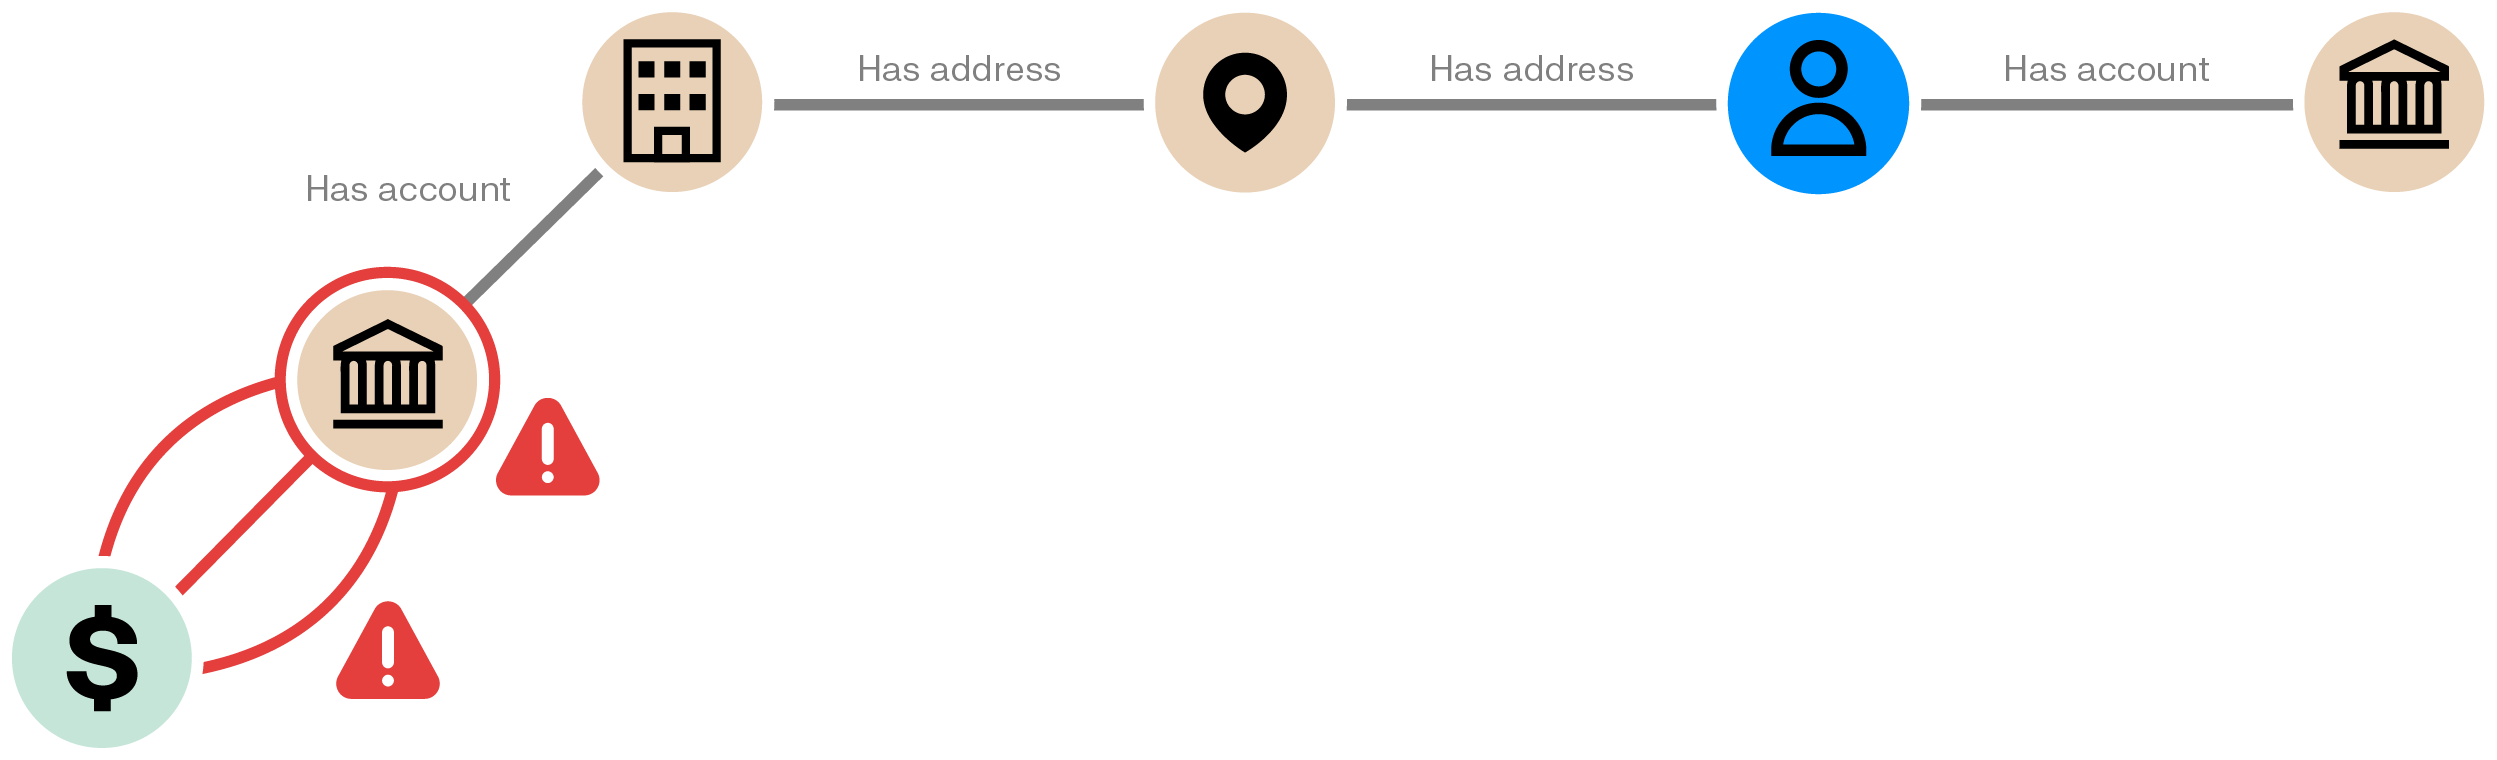
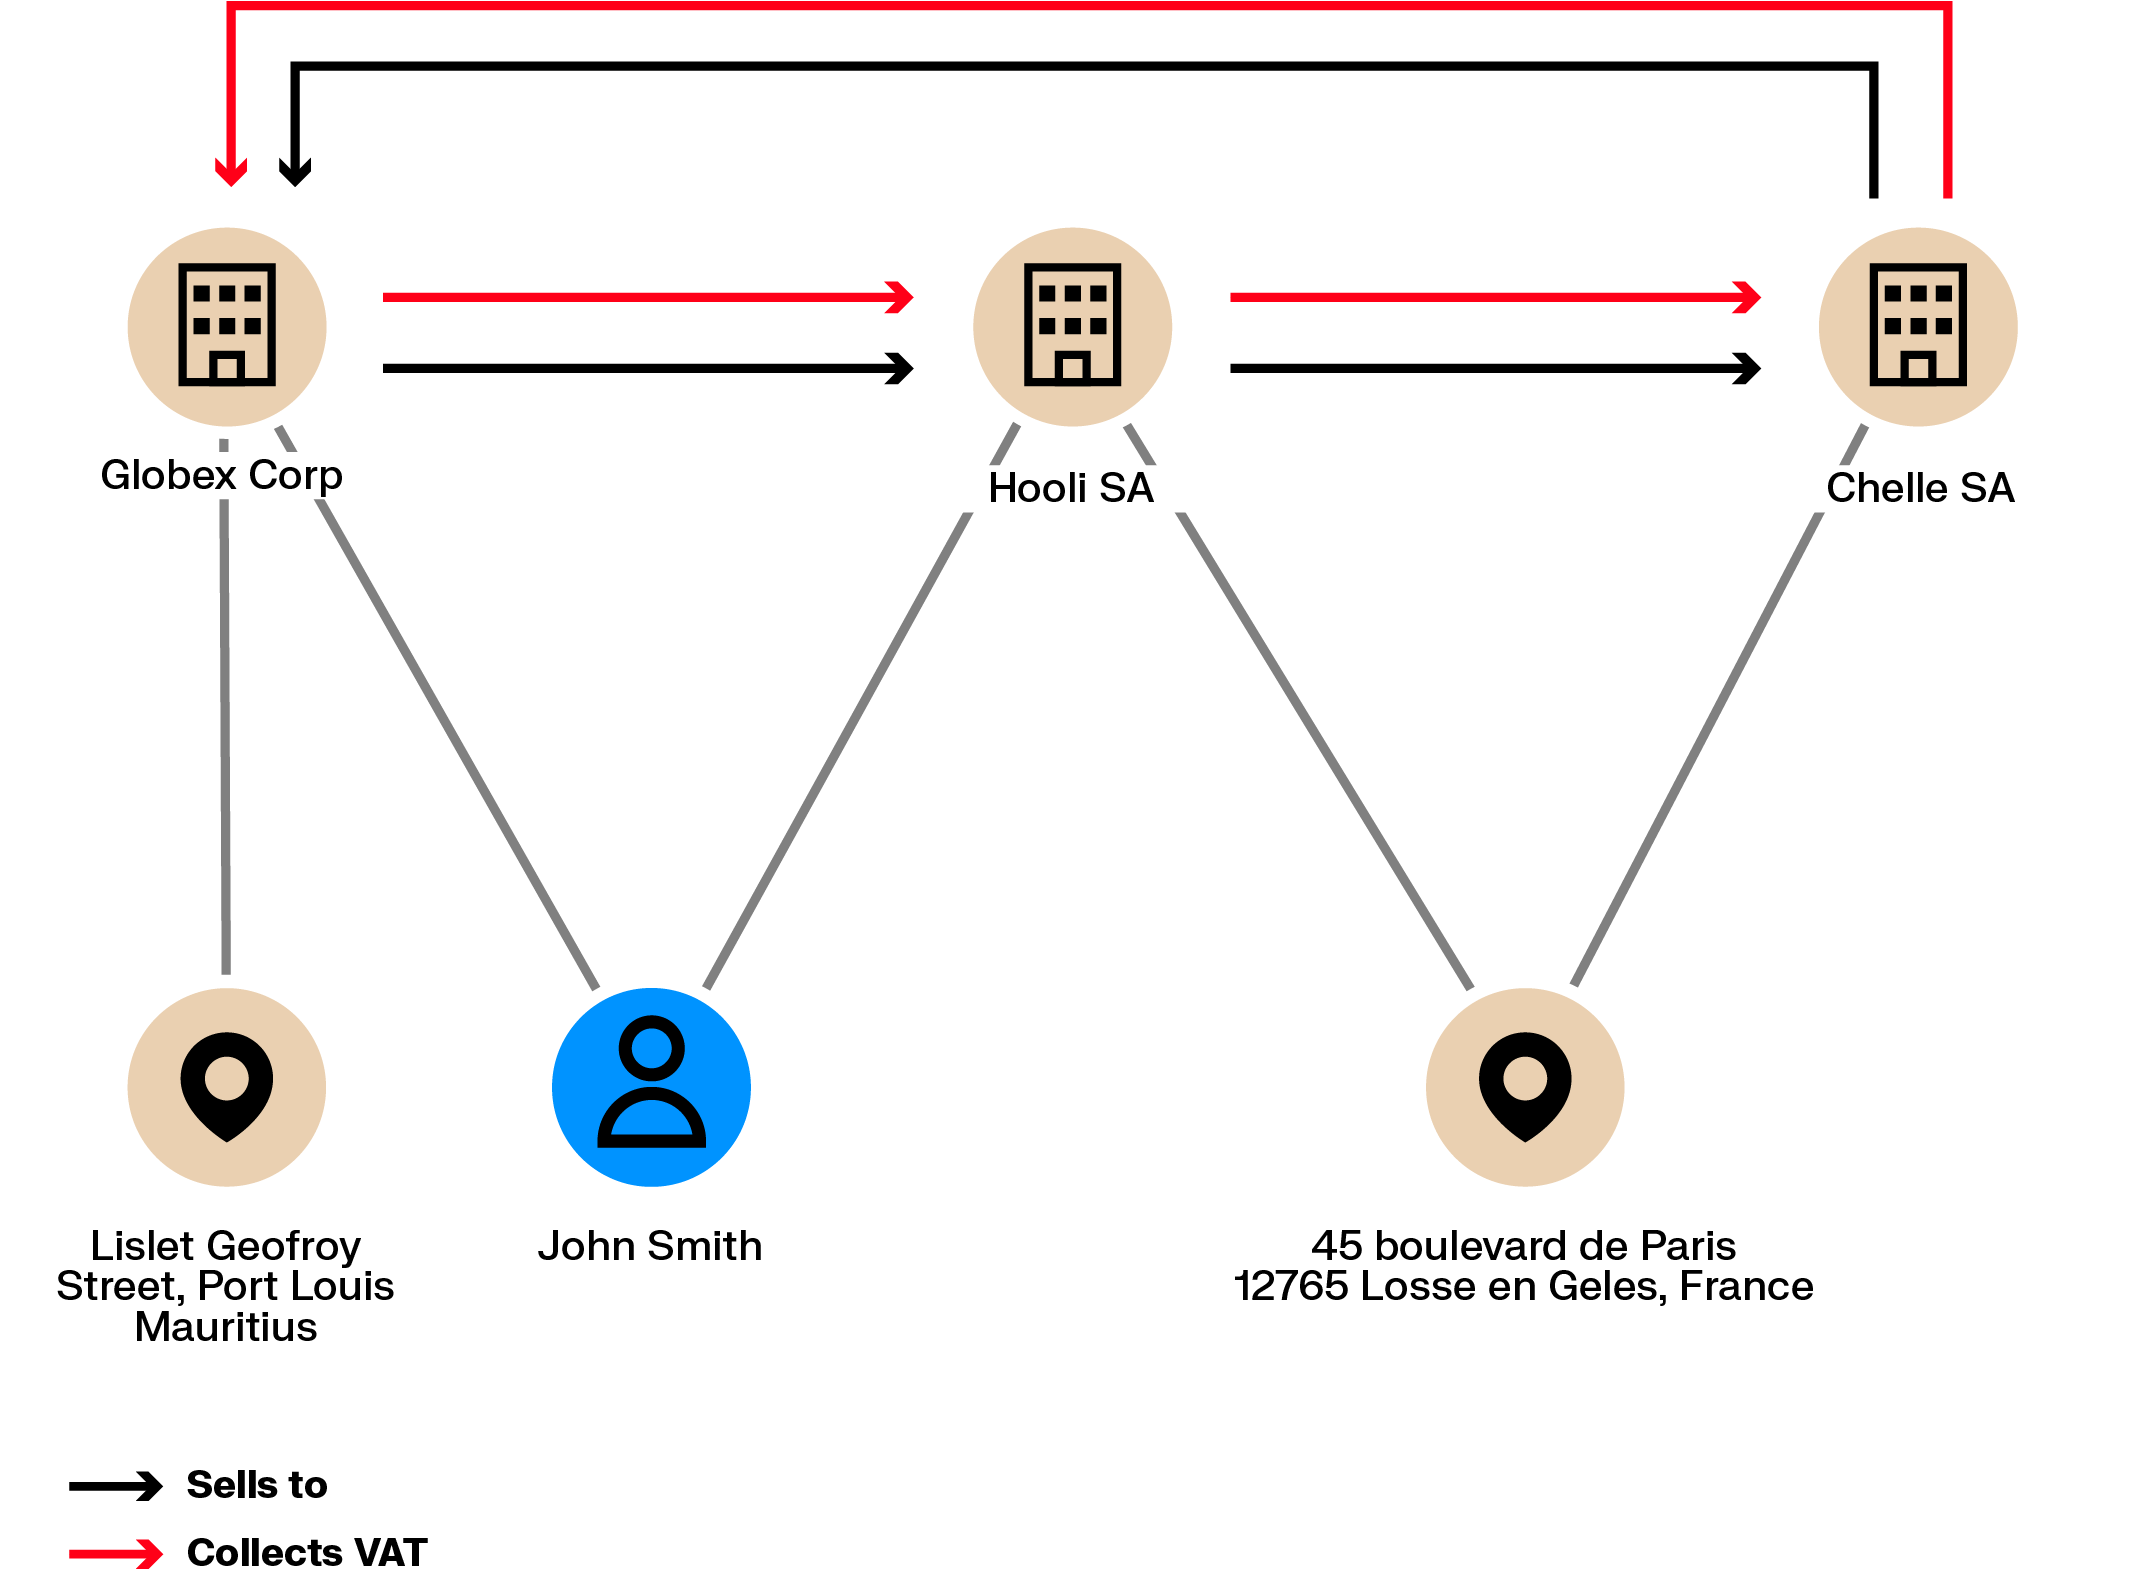
VAT fraud schemes use chains of international transactions to claim VAT refunds without paying VAT in the first place. These schemes often involve multiple cooperating companies and result in substantial losses for tax authorities.
Operating such schemes requires creating or controlling several companies, some of which may disappear after collecting VAT. These companies often share details such as directors, registered addresses, or contact information. Graph analytics can identify these links and help flag related entities before further losses occur.
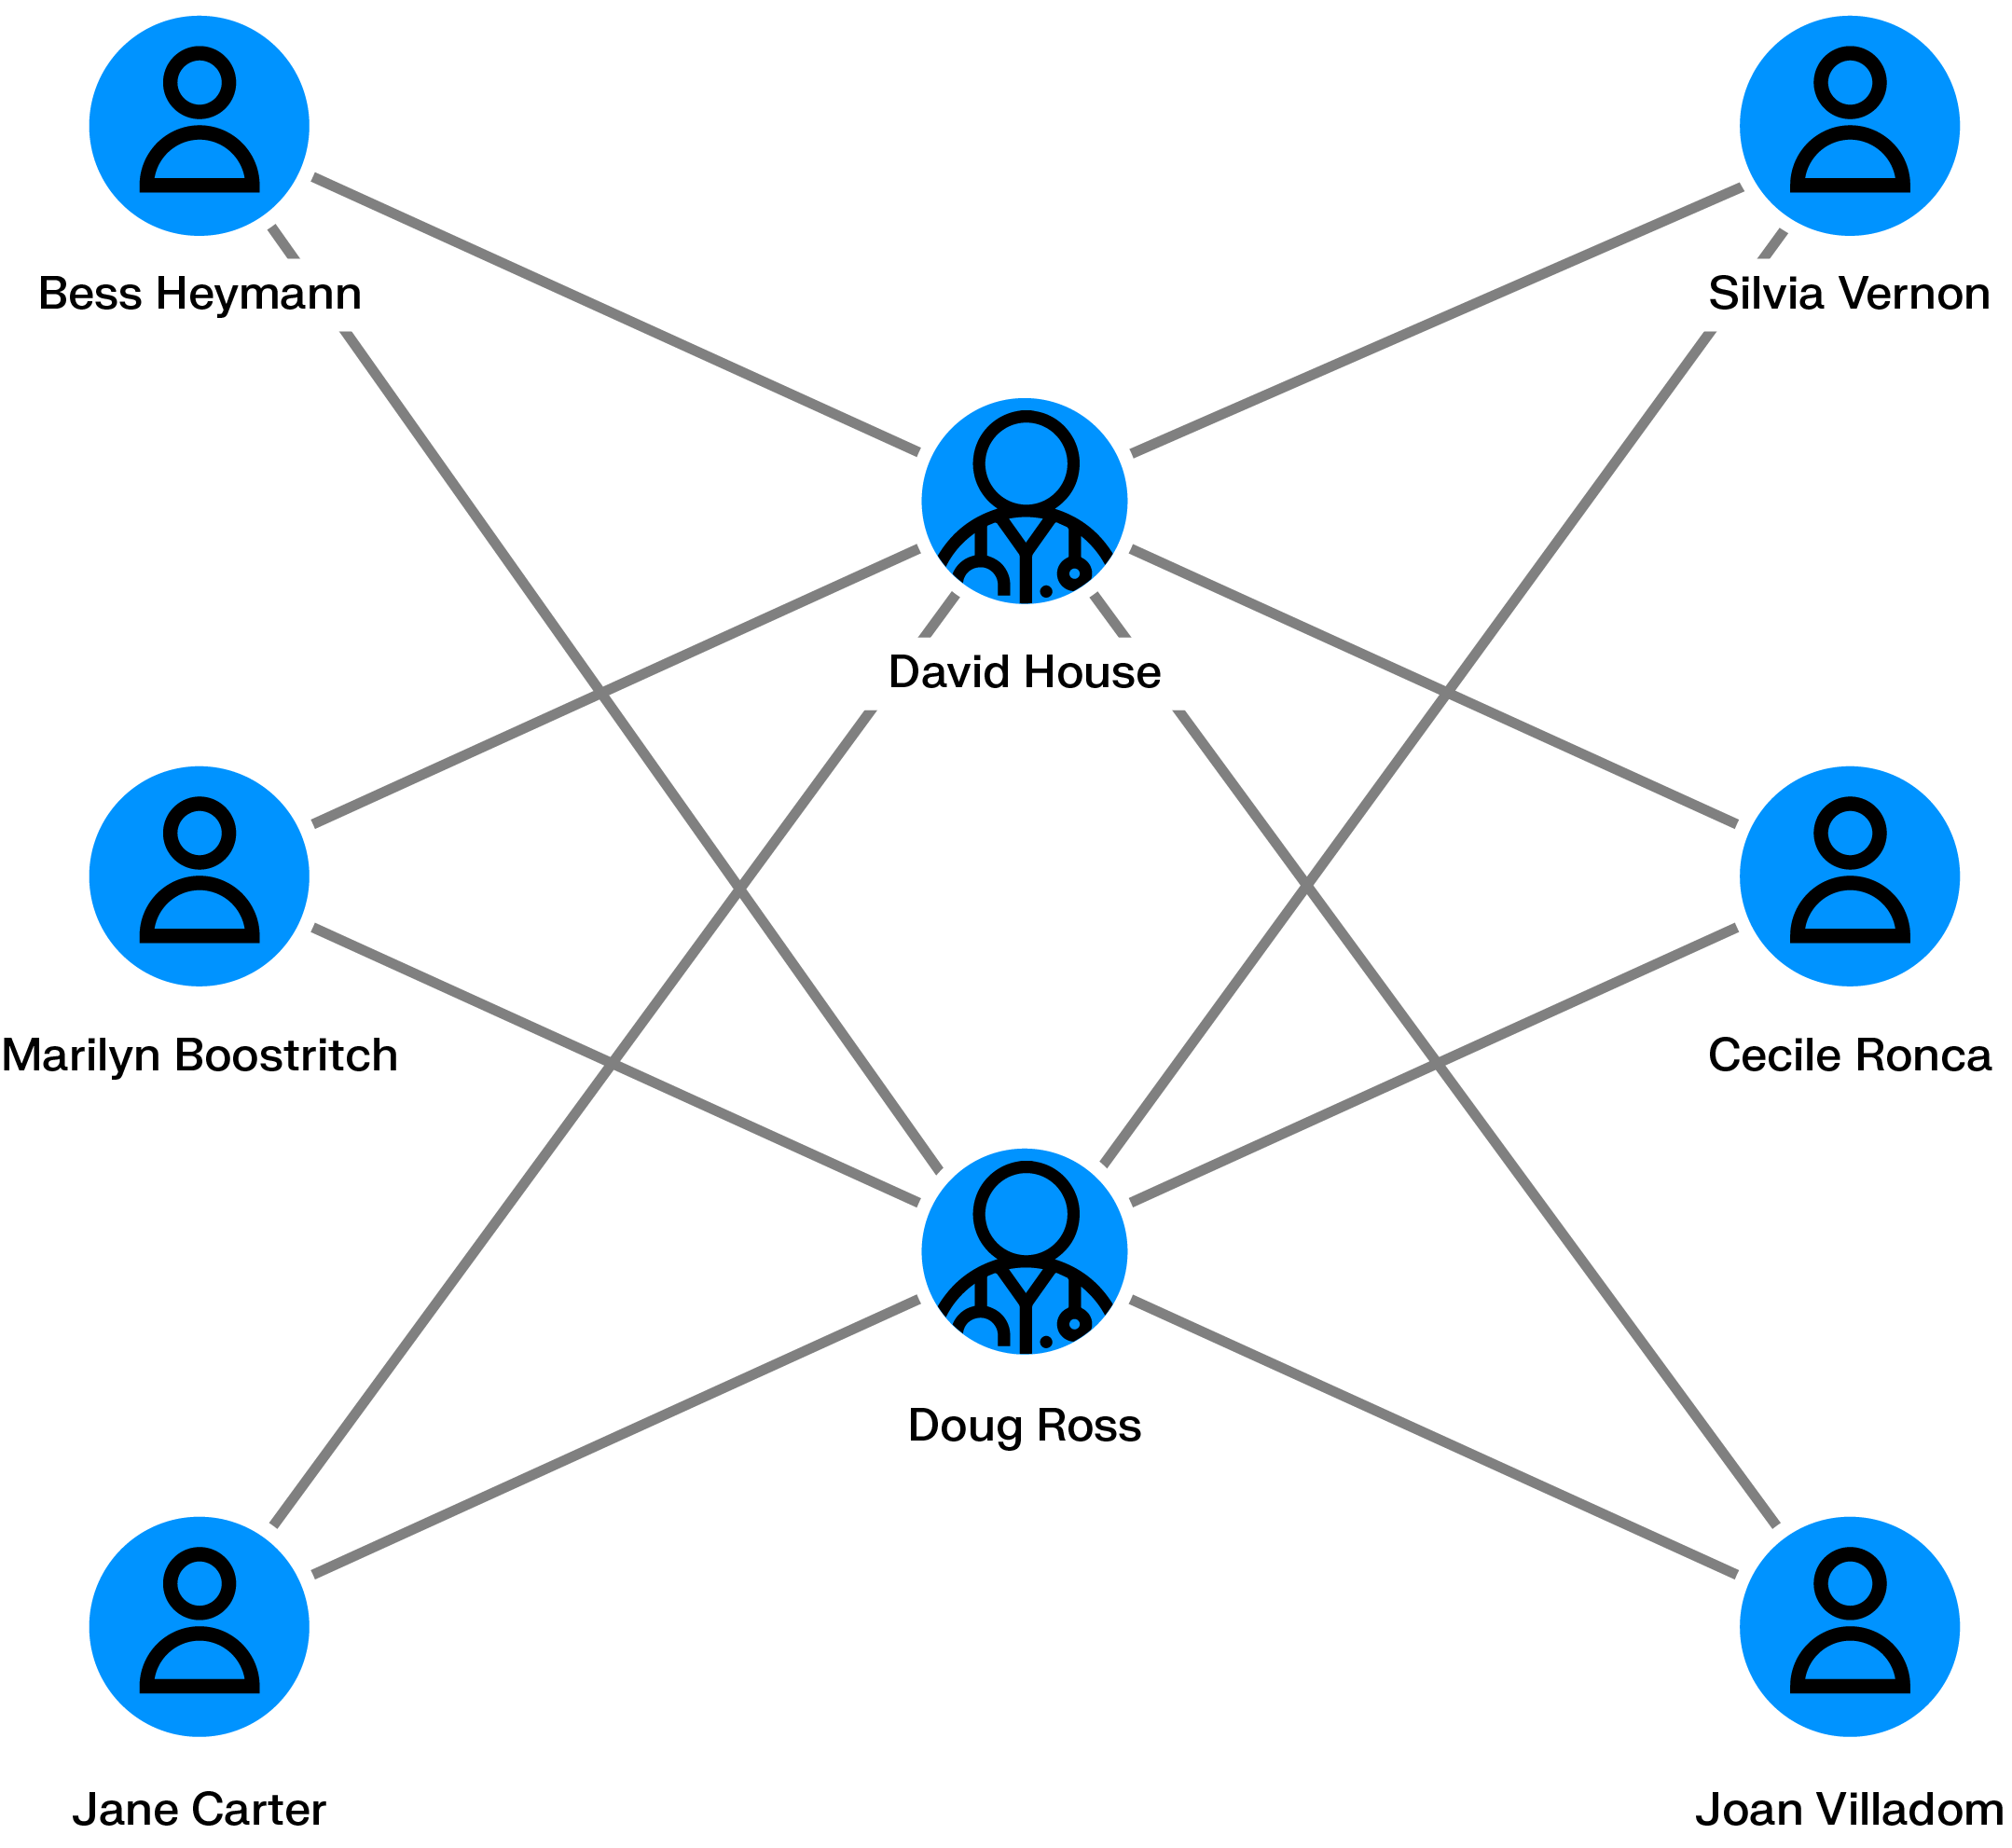
Corrupt practitioners may bill for services that were never provided, with institutions such as Medicare paying the claims. Detection is particularly difficult when services are claimed for elderly patients and appear legitimate in isolation.
Graph analytics help identify anomalies such as patients seeing multiple doctors for the same procedures, practitioners sharing many of the same patients, or repeated billing for identical services.
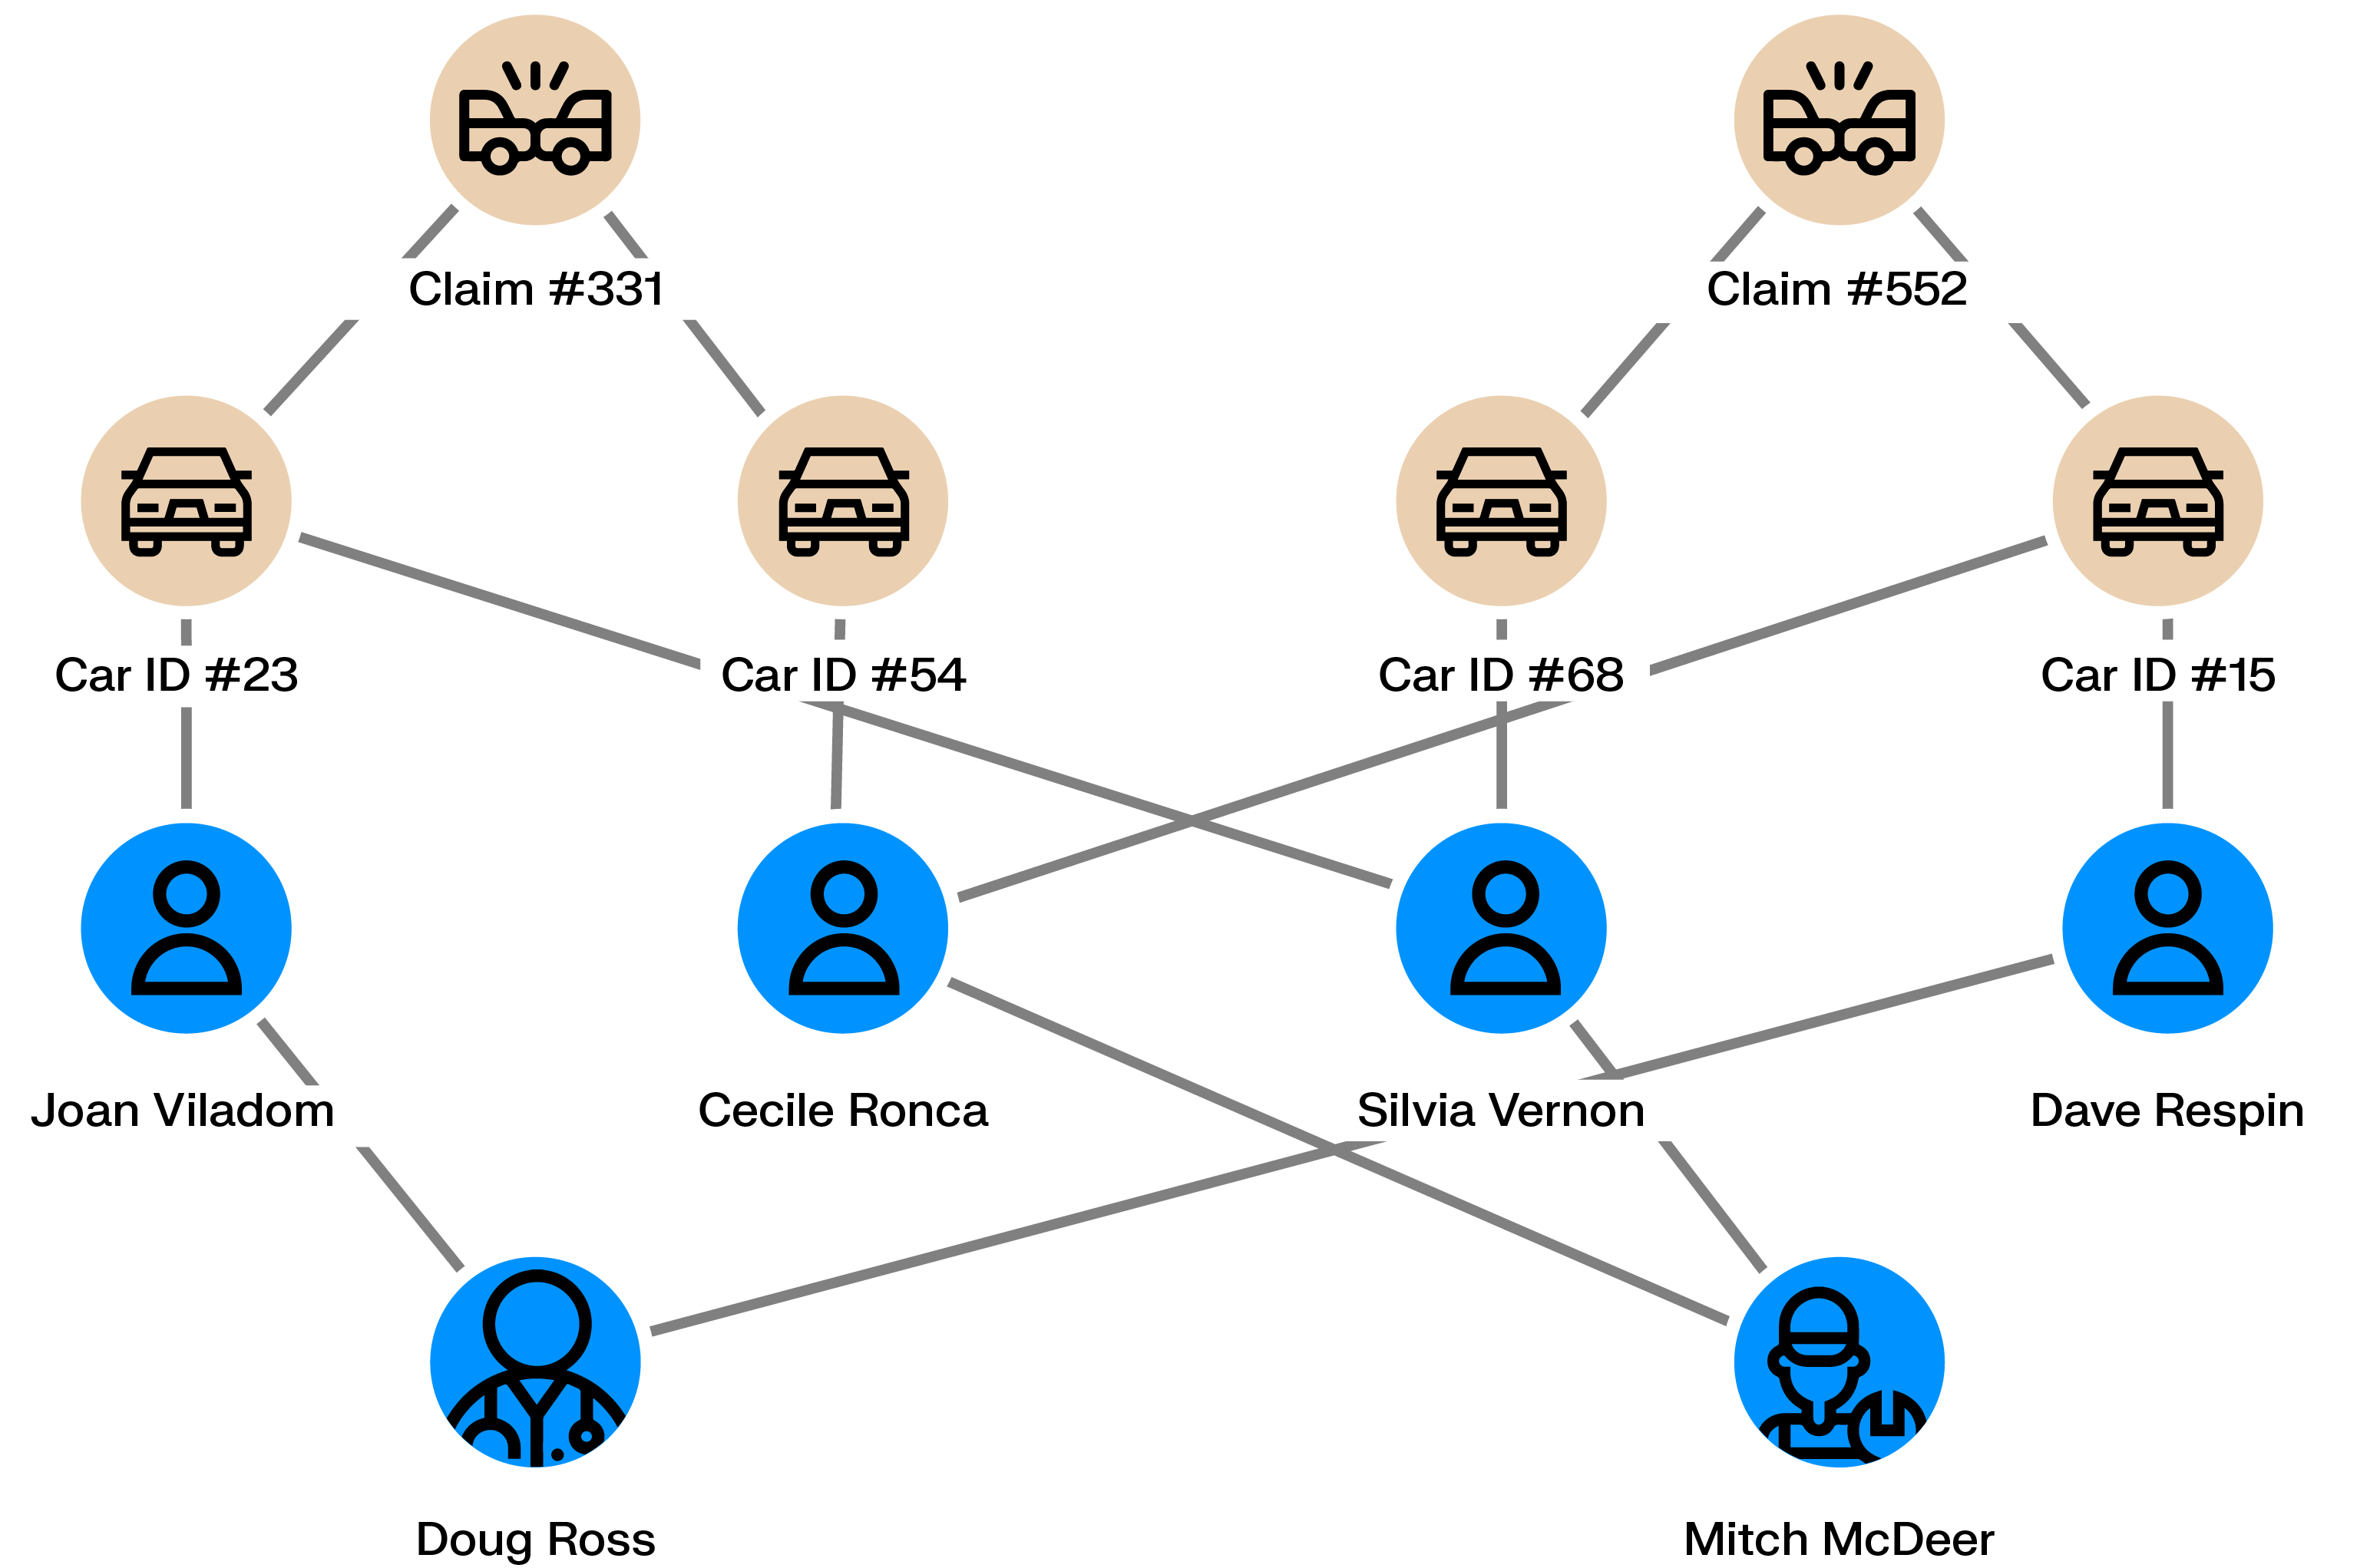
Generating fake insurance claims can be a way for fraudsters to make money. An individual can take a car insurance policy, then claim a refund on a non-existing car accident with the help of a car repair shop.
Scaling fake car accidents requires multiple policyholders, multiple cars and multiple car passengers. Graph analytics can help identify if within an insurance company’s client database multiple people are interconnected across cars, individuals, repair shops or claims. The larger the network, the more likely that fraud is going on.
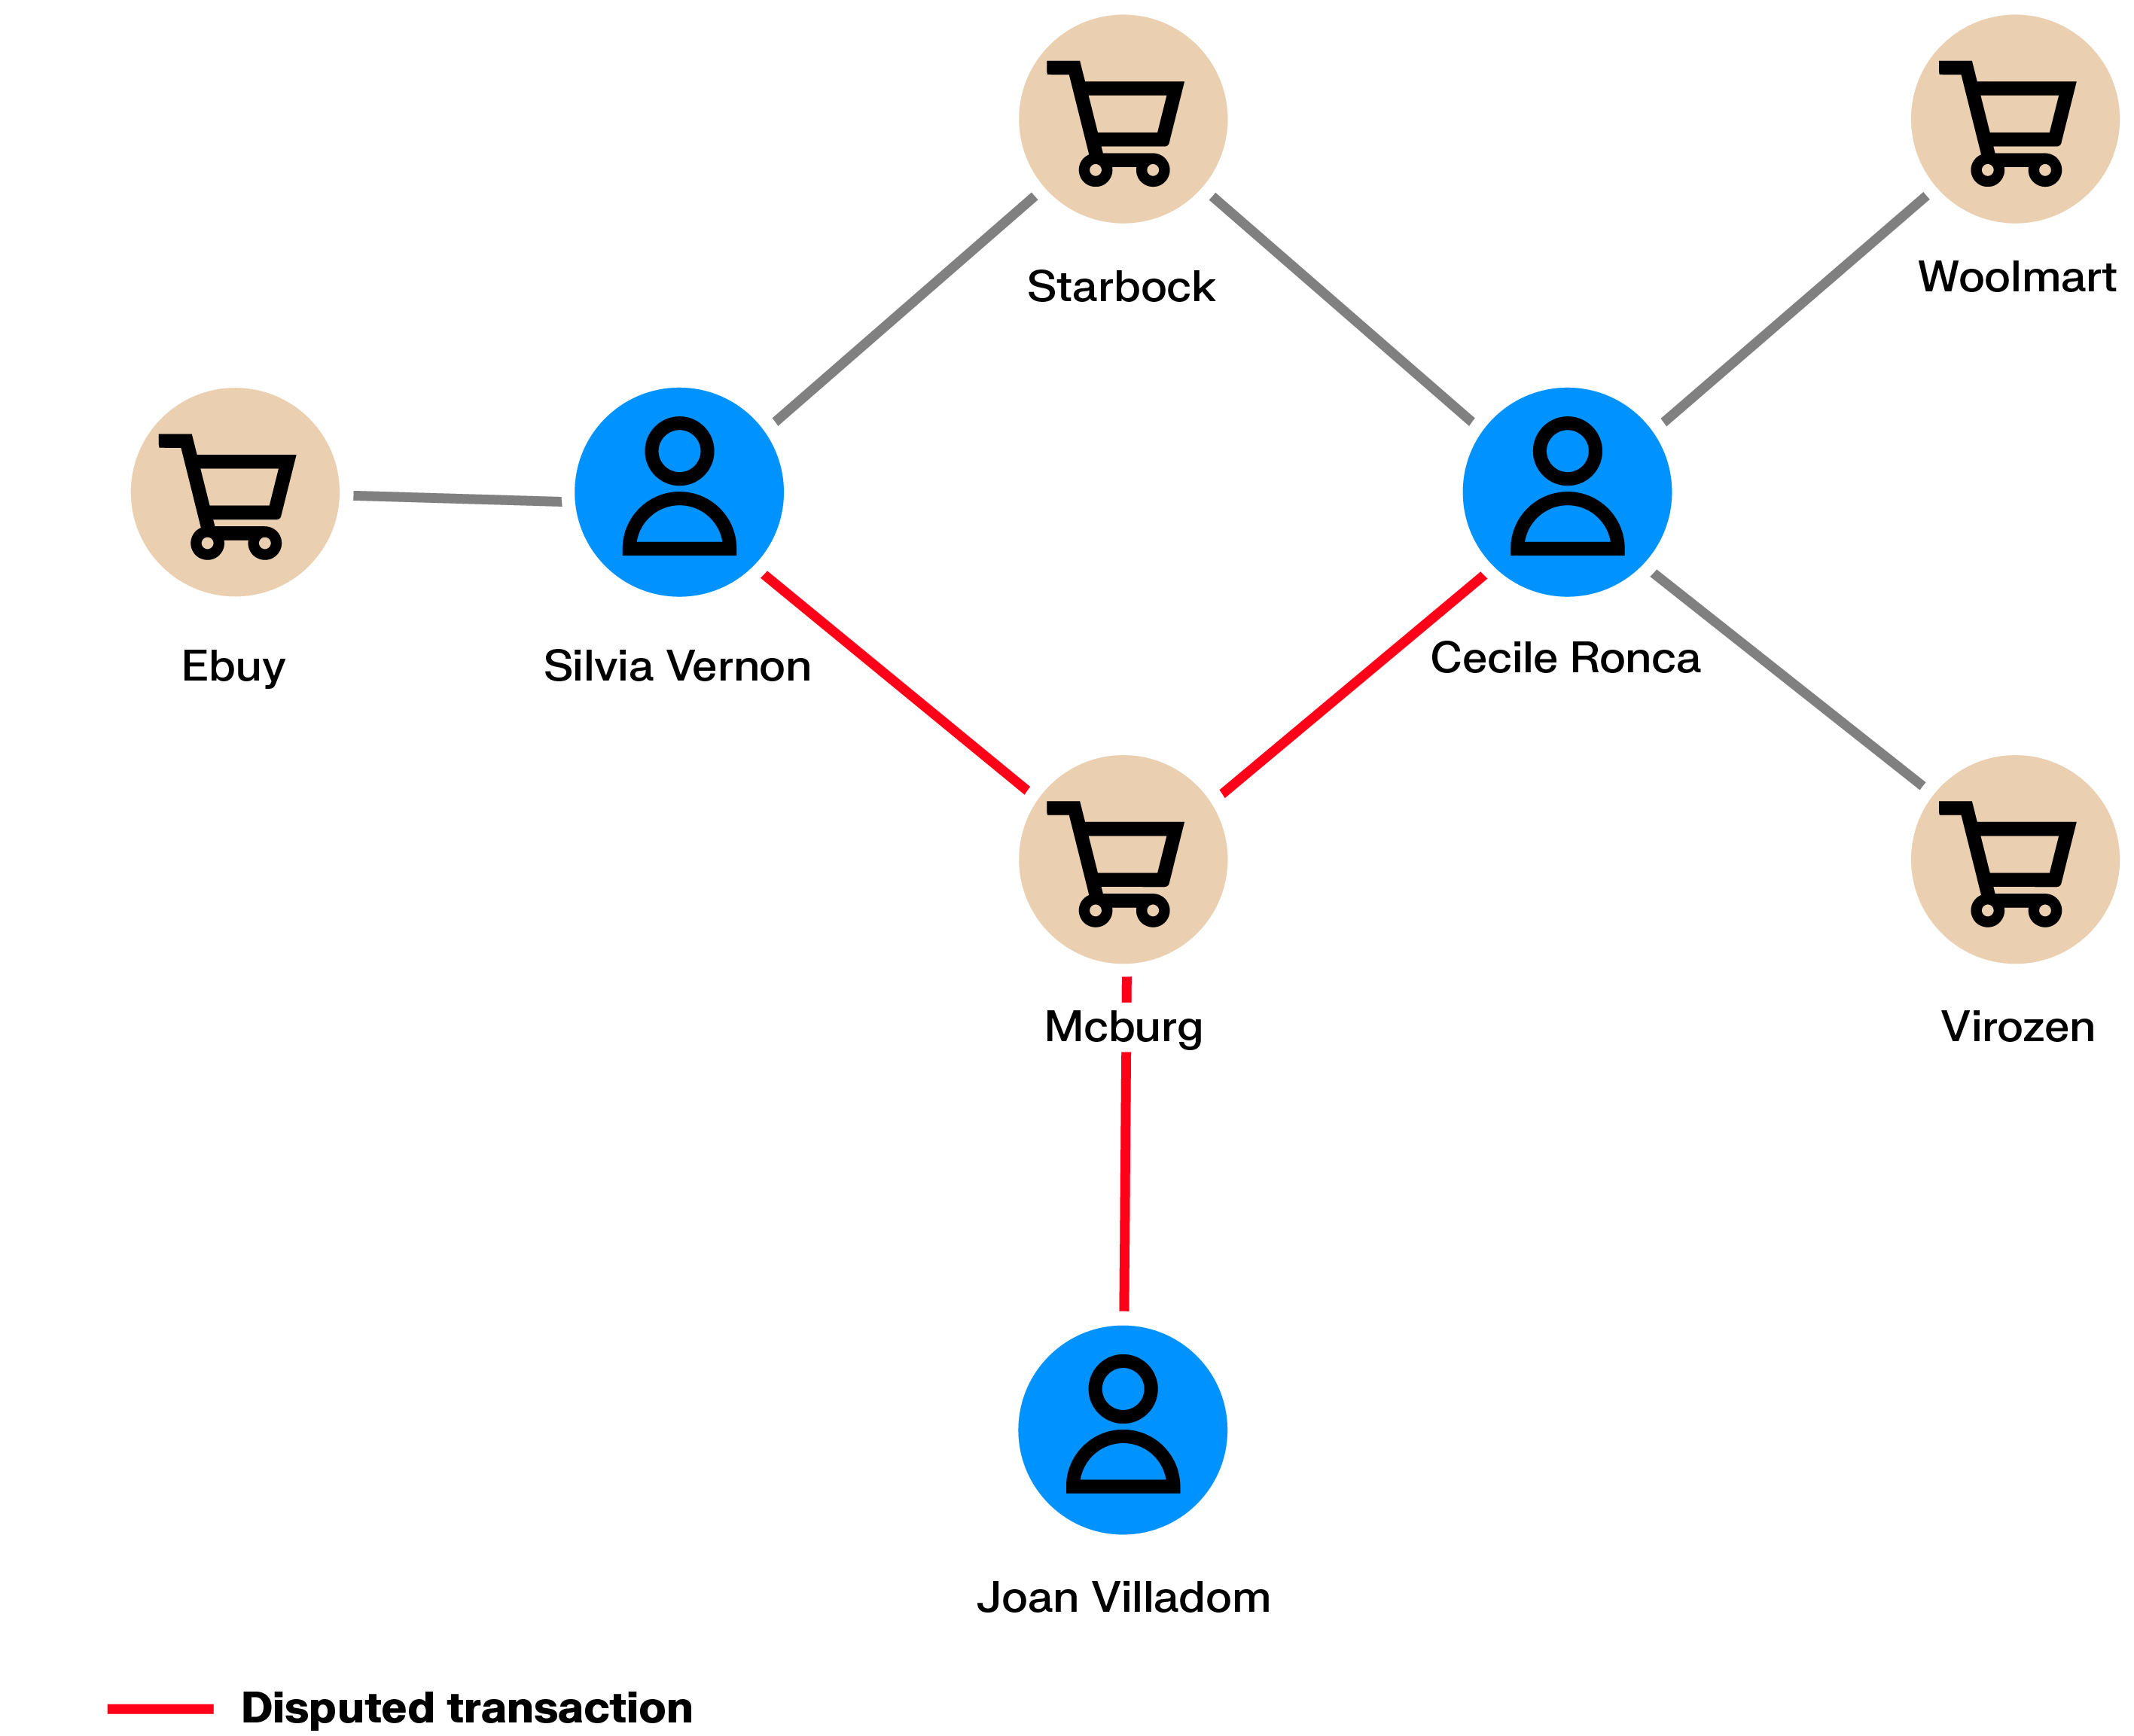
Skimming devices copy credit card details when cards are used at ATMs, gas pumps, or points of sale. The stolen data is later used for fraudulent transactions, often online.
Once transactions are reported as fraudulent, graph analytics can identify shared points of sale among affected cardholders. These connections help determine where card data was compromised and allow the skimming operation to be shut down.
Referral programs incentivize individuals to promote a product or company to their personal networks (for example, “win $200 if a friend creates an account”). These programs can be targeted by fraudsters who act as a group to generate referrals in order to capture the monetary rewards. Meanwhile, the company is not generating any business out of these fake clients.
In referral programs, a client refers other people as potential clients. What if some people are tied via personal information (IP address, bank account, address) to other people within the network or to other networks of referrers? Graph analytics can help identify these connections and thus uncover entire networks of referral abusers.
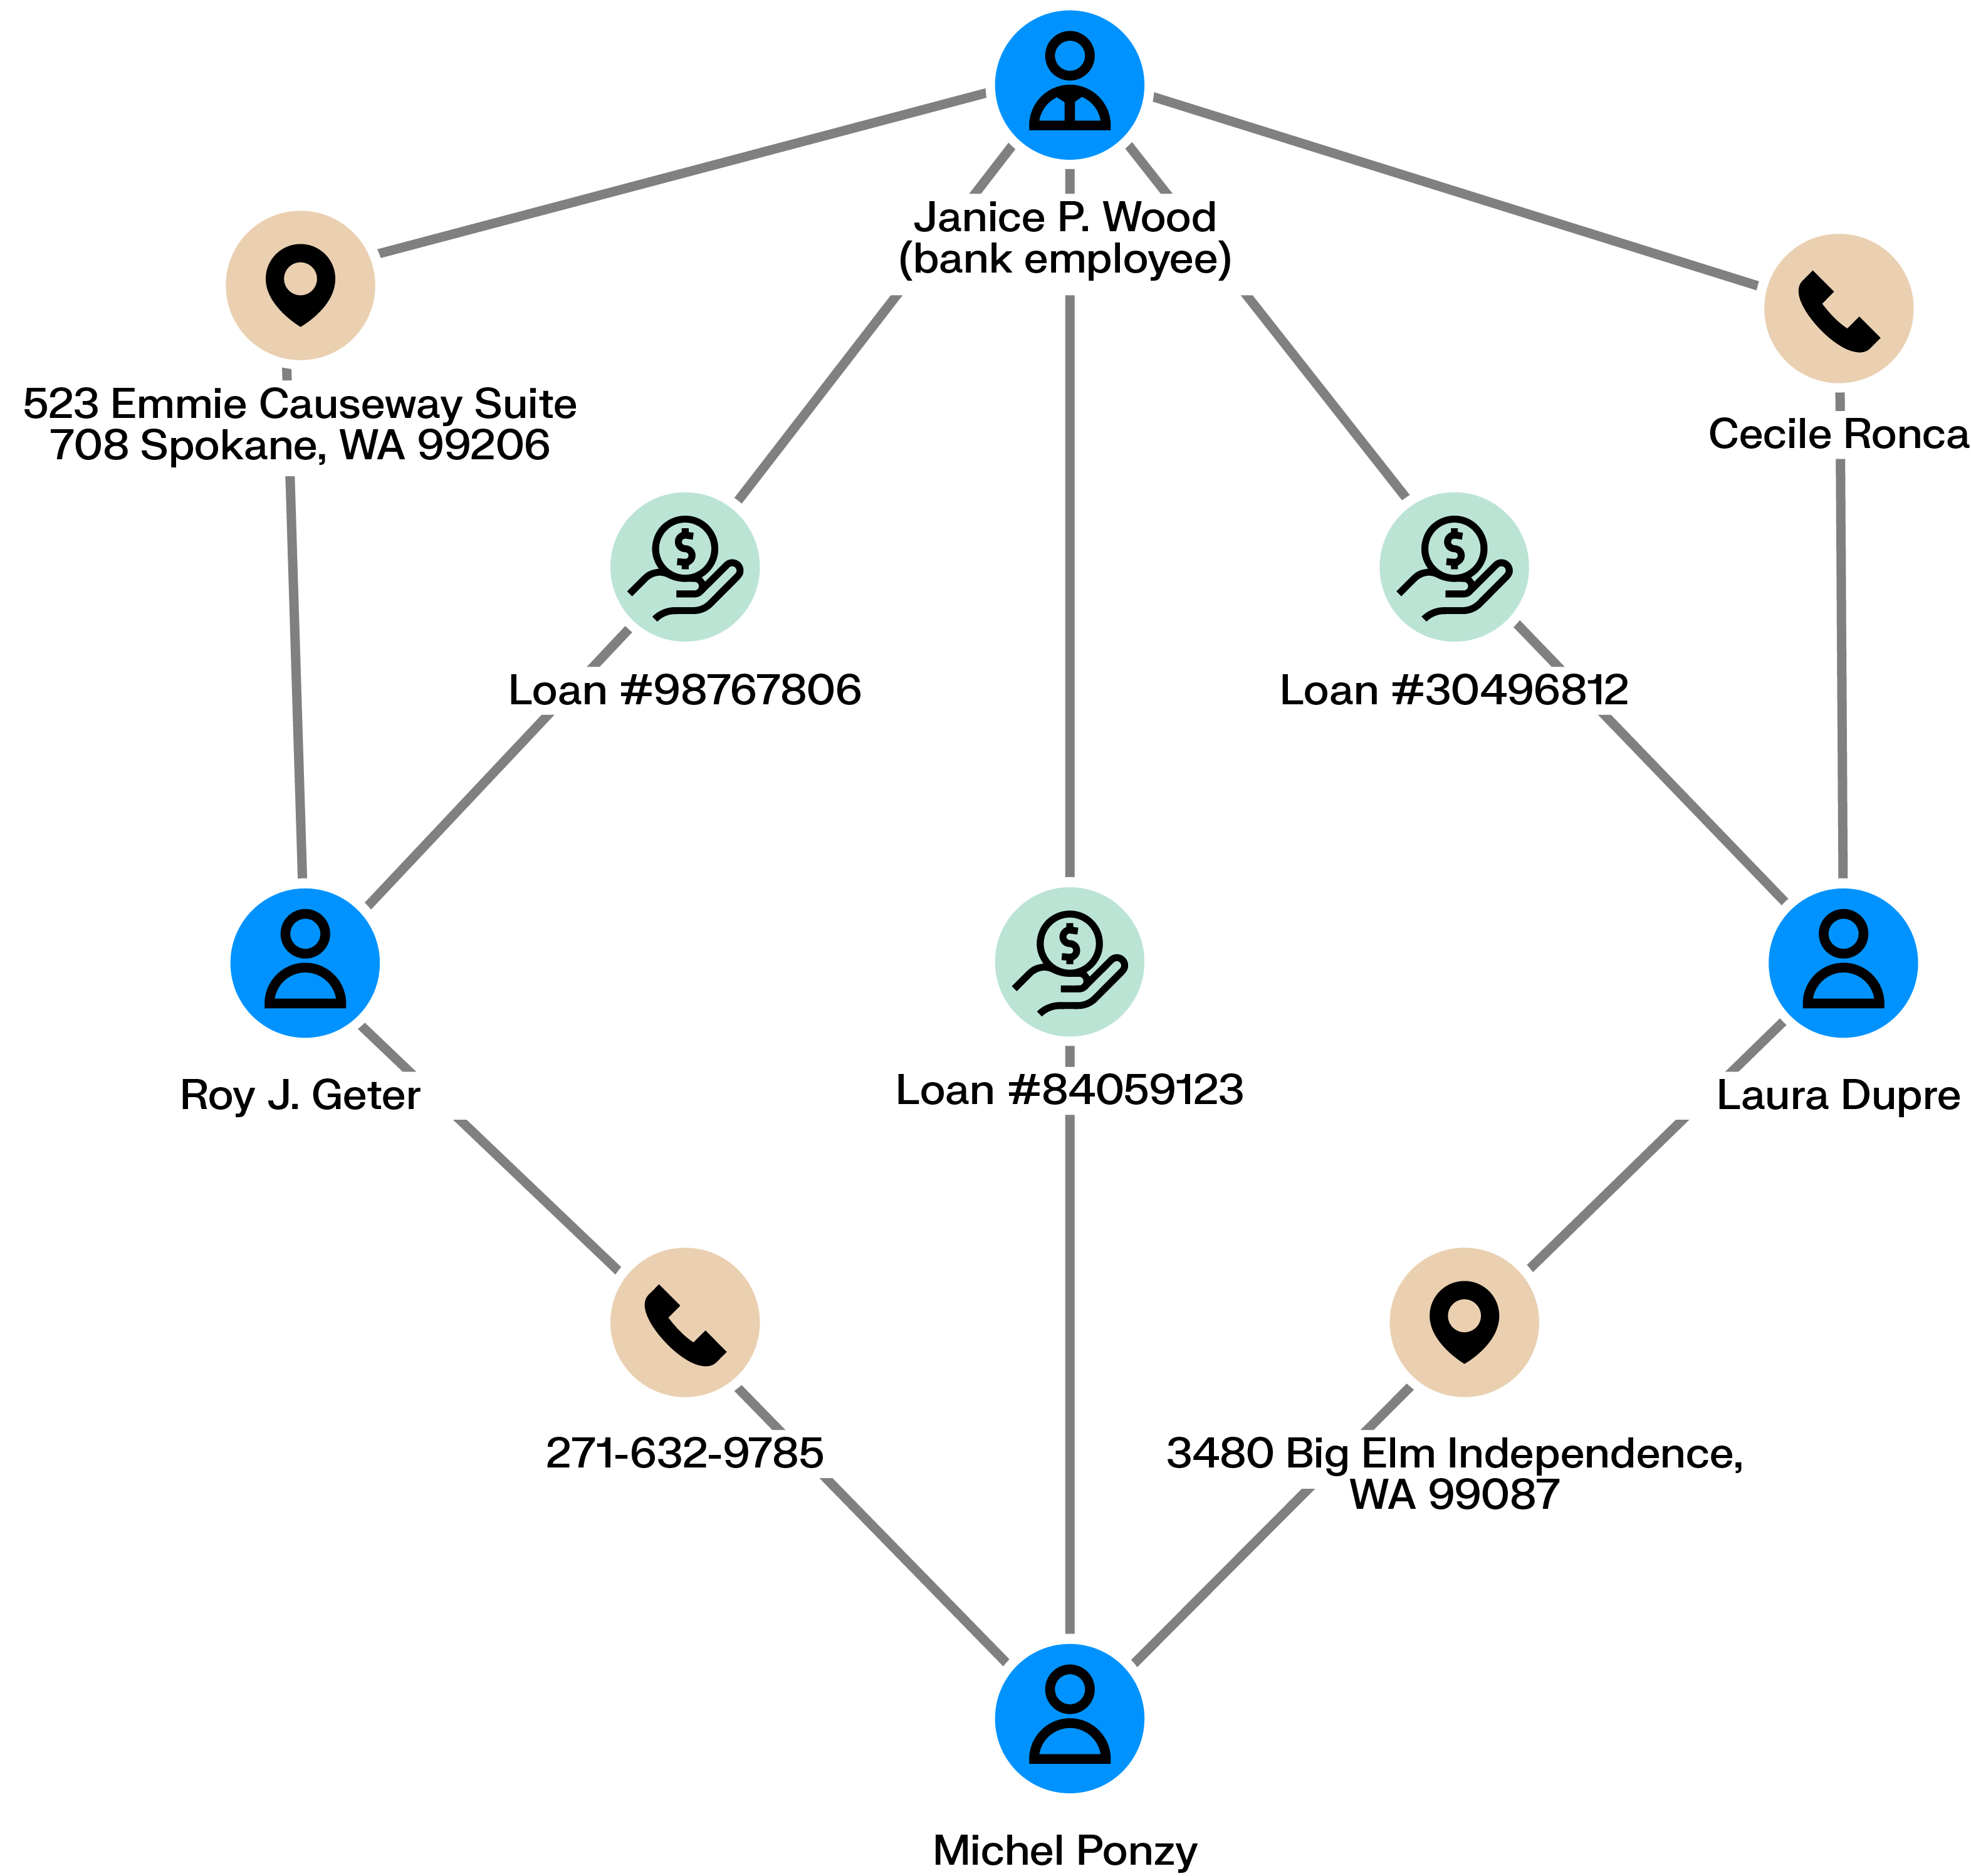
Employees handling credit loans can defraud the bank they work for. Accomplices can ask the bank for loans (using real or fake information) that the employee then accepts. The money can then be shared among the scheme’s perpetrators who never pay back the bank.
Is a given employee tied to multiple bad loans? Are there connections among clients with loans? Is there information within the loans shared across multiple loan applications? Graph analytics can help uncover those similarities and expose fraudsters.
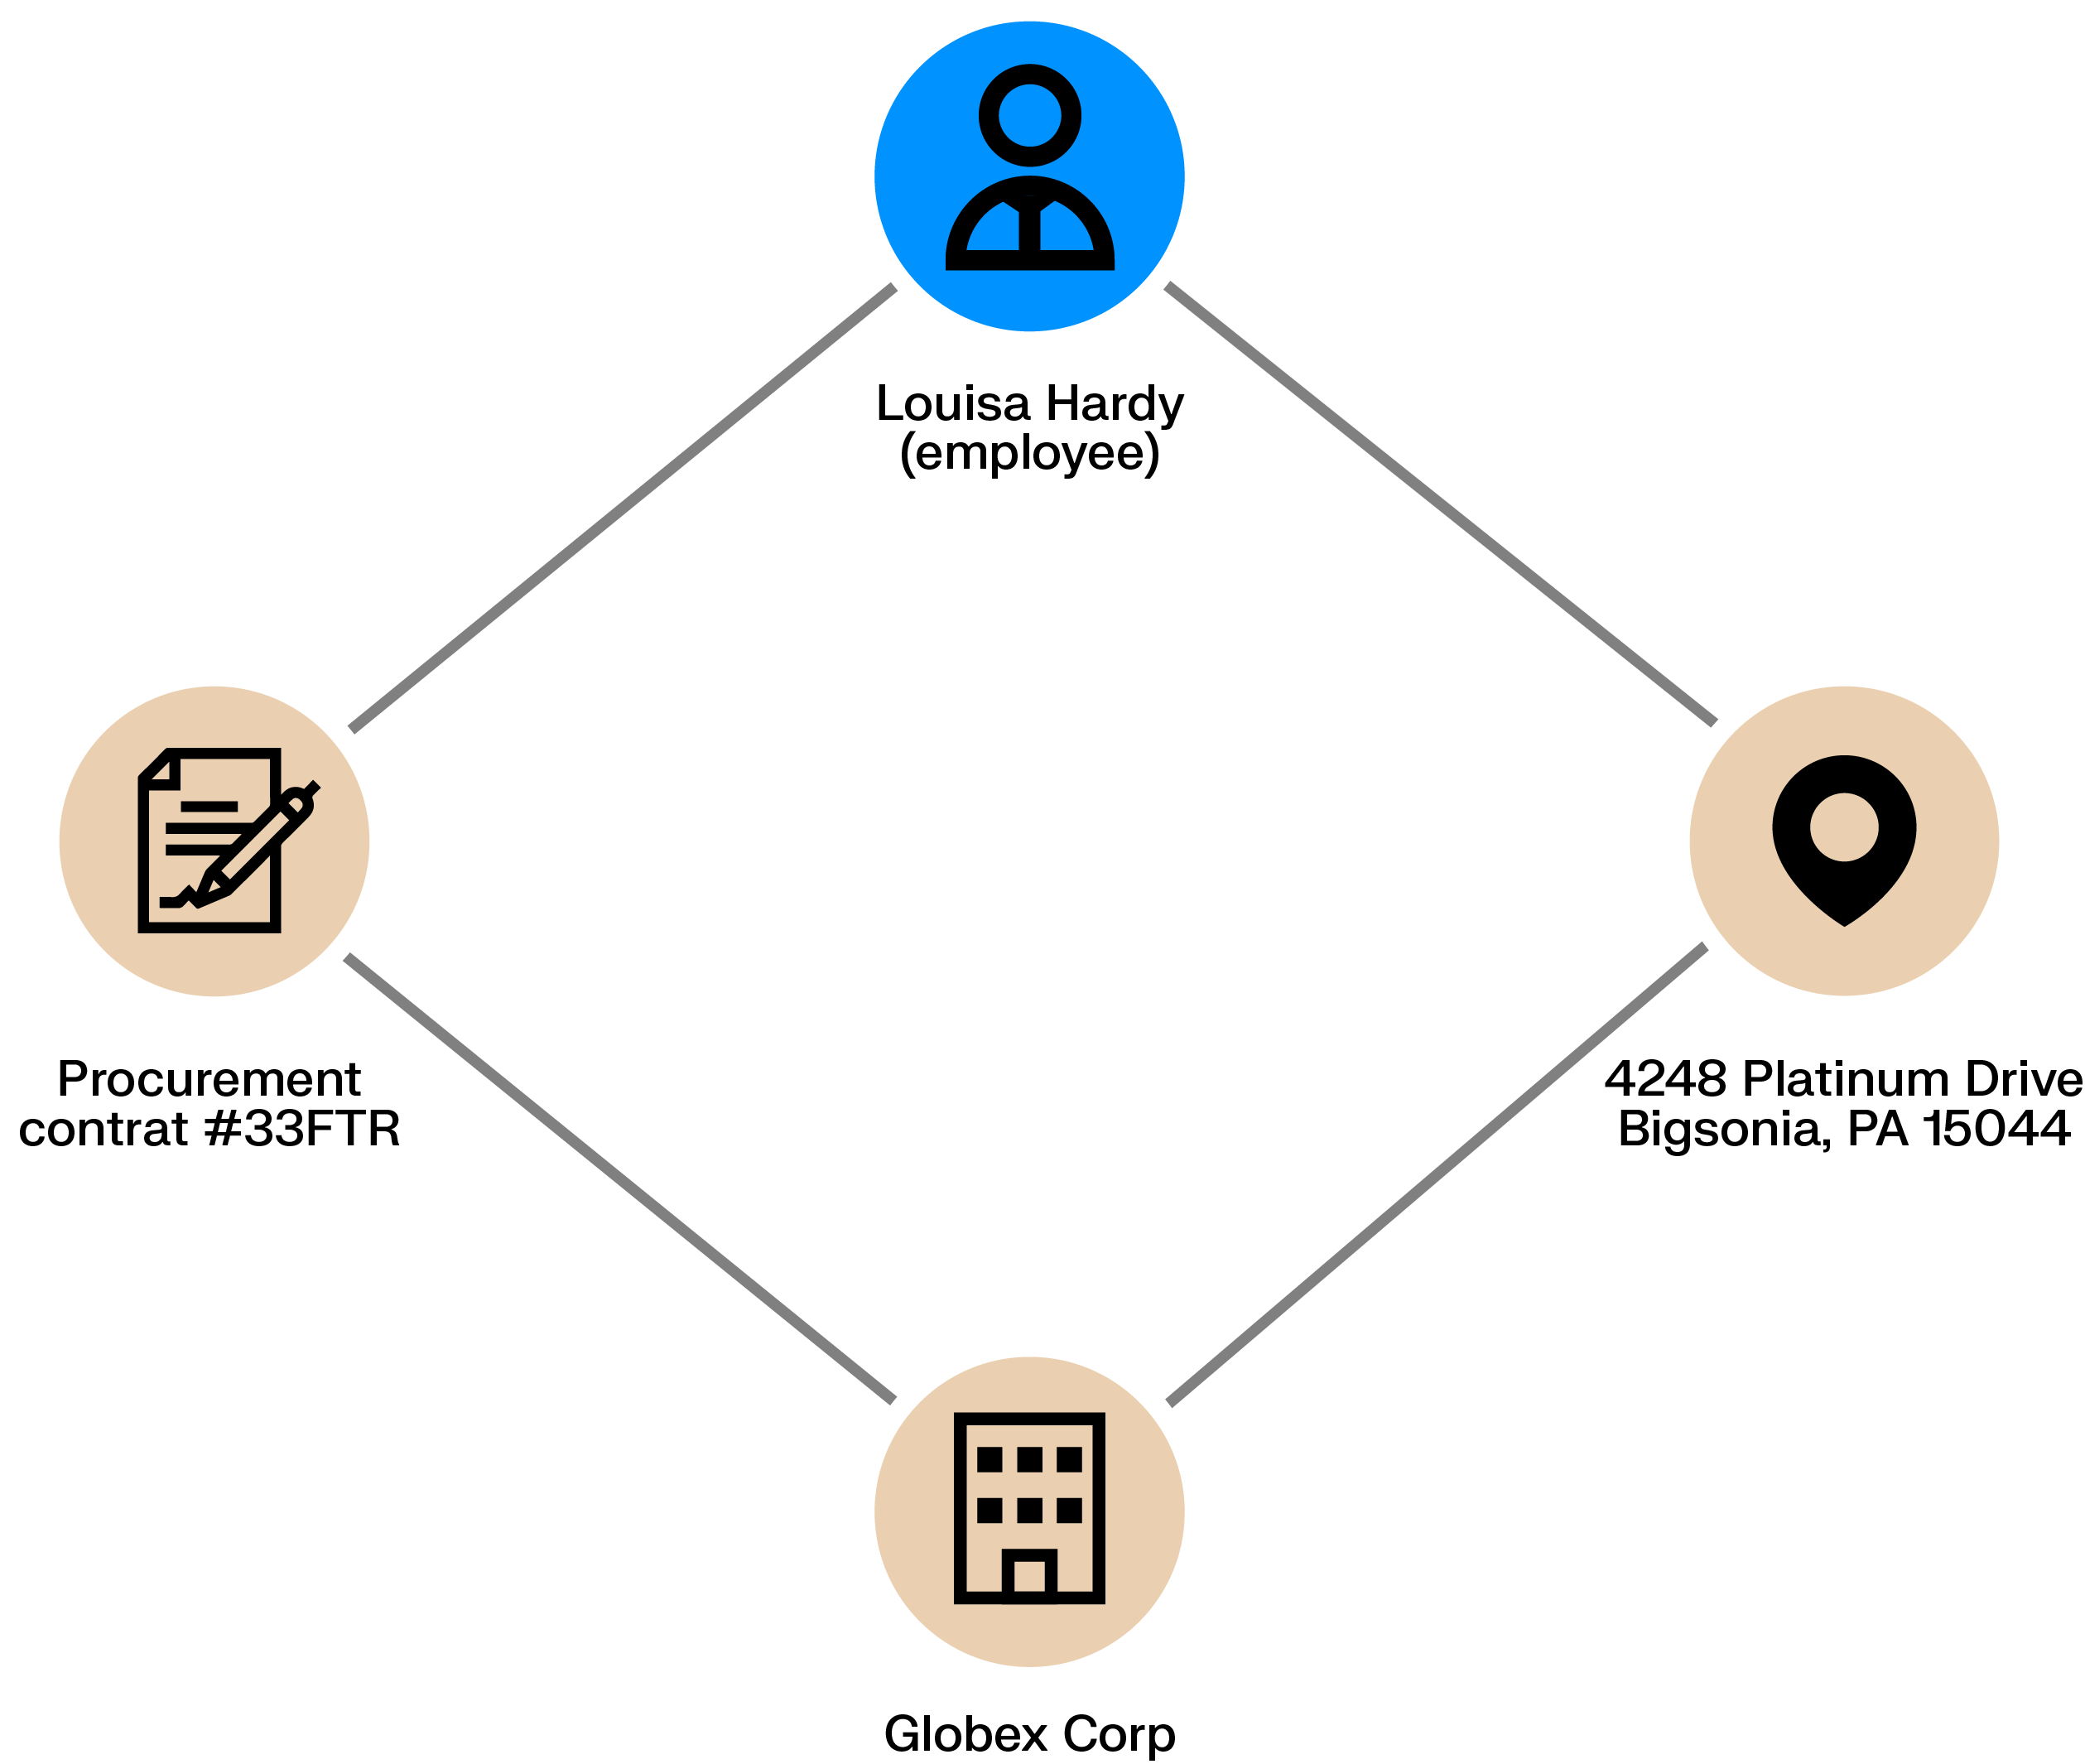
Procurement processes handle large volumes of routine transactions, creating room for fraud when controls are weak. A rogue employee may coordinate with a supplier to inflate contracts or approve improper payments, allowing losses to build quietly over time.
These schemes leave relational traces. Shared addresses, ownership ties, or repeated interactions between an employee and a supplier can reveal conflicts of interest and hidden dependencies before they escalate.
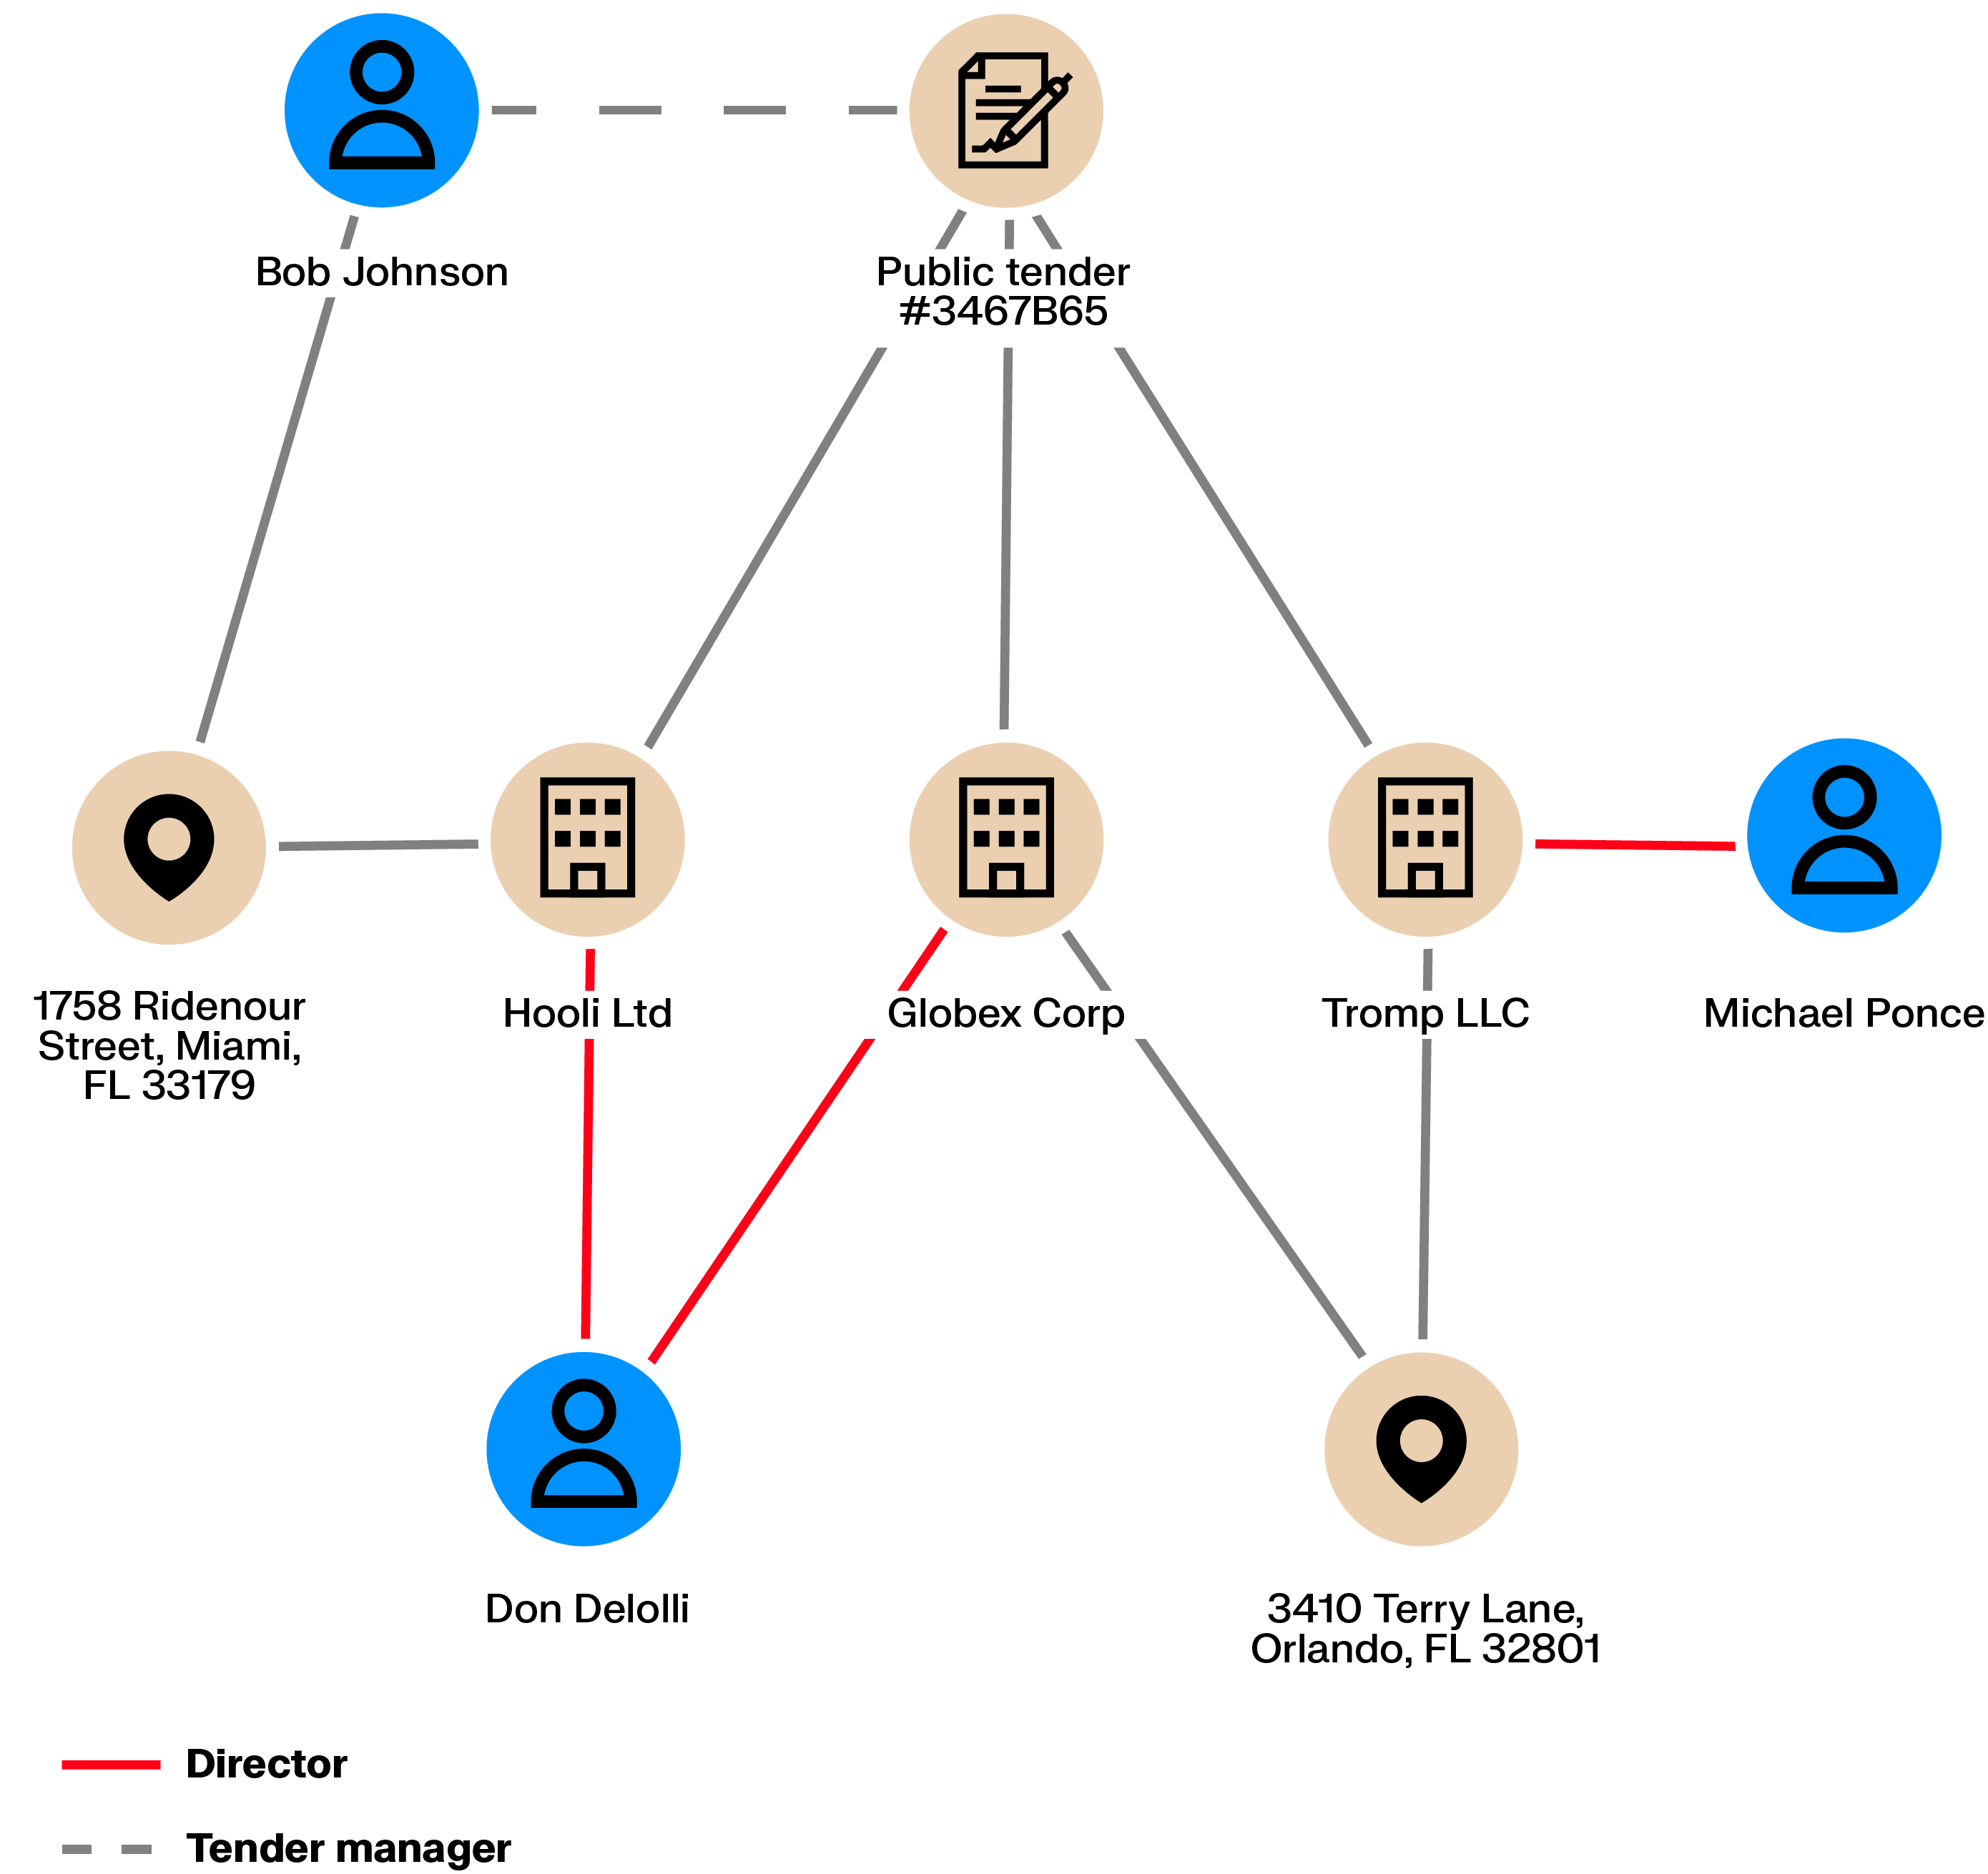
Public tenders are meant to enable an open competition to ensure low prices. What if the competition is rigged? Maybe a corrupt employee is cooperating with criminals to syphon off money. In this case, multiple organizations may take part in the tender to give the impression of competition but may actually collude to charge a higher price.
Collusion creates connections. Shared directors, ownership links, or intermediaries between bidders can be exposed through graph analytics, making coordinated behavior easier to detect.
Some cyber criminals send emails impersonating banks to harvest the credentials of their targets. This approach is called phishing and allows criminals to access their victims’ bank accounts and empty them. This represents a major threat for financial institutions in terms of brand equity and can severely damage the relationship with their customers.
These attacks rarely affect a single user. Graph analytics surface shared signals, such as one IP address accessing multiple accounts or the same recipient being added across users, helping teams respond earlier and more decisively.
Fraud schemes continue to grow more connected, more automated, and harder to disrupt with isolated rules or static views. As fraudsters reuse identities, infrastructure, and tactics across cases, investigation teams need faster ways to understand the full context around suspicious activity.
Linkurious helps investigation teams visualize everything connected to a suspicious client or transaction in seconds. This makes it easier to explore complex relationships, filter large datasets, and identify coordinated behavior early in an investigation, uncovering schemes that often remain hidden with traditional rule-based systems.
Teams using graph analytics report measurable improvements, from faster case triage to higher detection rates. Whether deployed on-premise or in the cloud, graph-based investigations scale to meet the complexity of modern fraud.
To see how graph analytics support fraud detection in practice, explore our resources.

A spotlight on graph technology directly in your inbox.