Insurance fraud is an expensive problem, and not just for the companies absorbing the losses. According to the Coalition Against Insurance Fraud (CAIF), it costs the US economy $308.6 billion annually, and the impact on individual consumers is just as real. The CAIF estimates that insurance fraud costs the average US customer around $900 per year in higher premiums. Those numbers add up fast, and they fall on people who never filed a fraudulent claim.
The people behind these schemes aren't amateurs. Many operate like professionals, running organized groups with the systems, patience, and expertise to exploit gaps that traditional investigation tools weren't built to catch. So what makes fraud investigation this hard, and how exactly does advanced network analytics technology help investigators go deeper and move faster
Insurance companies rely on special investigations units to detect and investigate suspected fraud. Within these teams, analysts continuously screen claims activity for indicators that fraud may be occurring. Those analysts work under significant time pressure as they investigate possible insurance fraud.
Not every suspicious claim will prove fraudulent, and legitimate claims must be reimbursed quickly. Yet investigators must also ensure that genuinely fraudulent claims don't go undetected.
It helps to understand that insurance fraud generally falls into two categories:
- Hard fraud: Involves claims that are completely fabricated, like a staged car accident, an arson fire, an injury that never happened.
- Soft fraud: Sometimes called opportunistic fraud, it is more common and harder to spot: the underlying incident is real, but the claimant inflates the value to make a profit, adding items to a theft claim that were never stolen, or exaggerating the severity of an injury.
Both types are regularly used by organized criminal groups to defraud insurers. These types of fraud cost insurers significant money, and both require investigators to look carefully at the details rather than simply taking a claim at face value.
Today, insurance fraud investigations units are relying increasingly on new technology and new investigation methods to speed up investigations without sacrificing accuracy, all while providing positive customer experiences.
A few structural challenges make the job of insurance fraud investigation harder than it might appear from the outside.
Fraud has become more organized over time. The most damaging schemes aren't isolated individuals padding a claim here and there. They're coordinated operations, sometimes spanning dozens of participants across multiple claims, and the more layers a scheme has, the harder it becomes to see the full picture from any single data point. A survey found that 68% of insurers anticipate fraud levels will increase over the next three to five years, which means investigators are always working against a moving target.
Insurance fraud investigations run on data. Investigators pull from a wide mix of sources, including:
- Internal data
- National and international databases
- Social media data
- Any other information potentially related to a claim: billing data, medical history data, and more
The challenge is connecting the dots across all of it. When this data is siloed, this work is time-consuming and prone to error.
Automated detection tools help flag suspicious activity so investigators know where to look. But traditional rules-based systems come with a well-known drawback: they flag a lot of things that turn out to be nothing, which creates its own pile of work. And even legitimate alerts often leave investigators having to manually piece together data as they build a case.
At the core of most insurance fraud investigations is one fundamental question: is this situation isolated, or is it part of something larger? A suspicious claim might look entirely manageable on its own. Zoom out and connect the dots, and it could turn out to be one piece in a network of dozens of people running coordinated scams across multiple insurers and jurisdictions.
Graph analytics can be a powerful solution to this challenge. Graph’s advantage is that it analyzes both individual data points (called nodes) and the connections between them (referred to as edges or relationships). Graph technology thrives on high levels of complexity and uses advanced algorithms to connect the dots between multiple data points and sources to quickly surface suspicious connections. The practical results are faster case triage, fewer false positives, and a much clearer view of how a fraud scheme actually holds together.
Here are some examples of how graph analytics can help make insurance fraud investigation faster and easier to manage.
Staged car accidents are a well-documented example of organized insurance fraud, and the scale of the problem is growing: auto insurance fraud increased by 19% worldwide in 2023, driven largely by staged accidents.
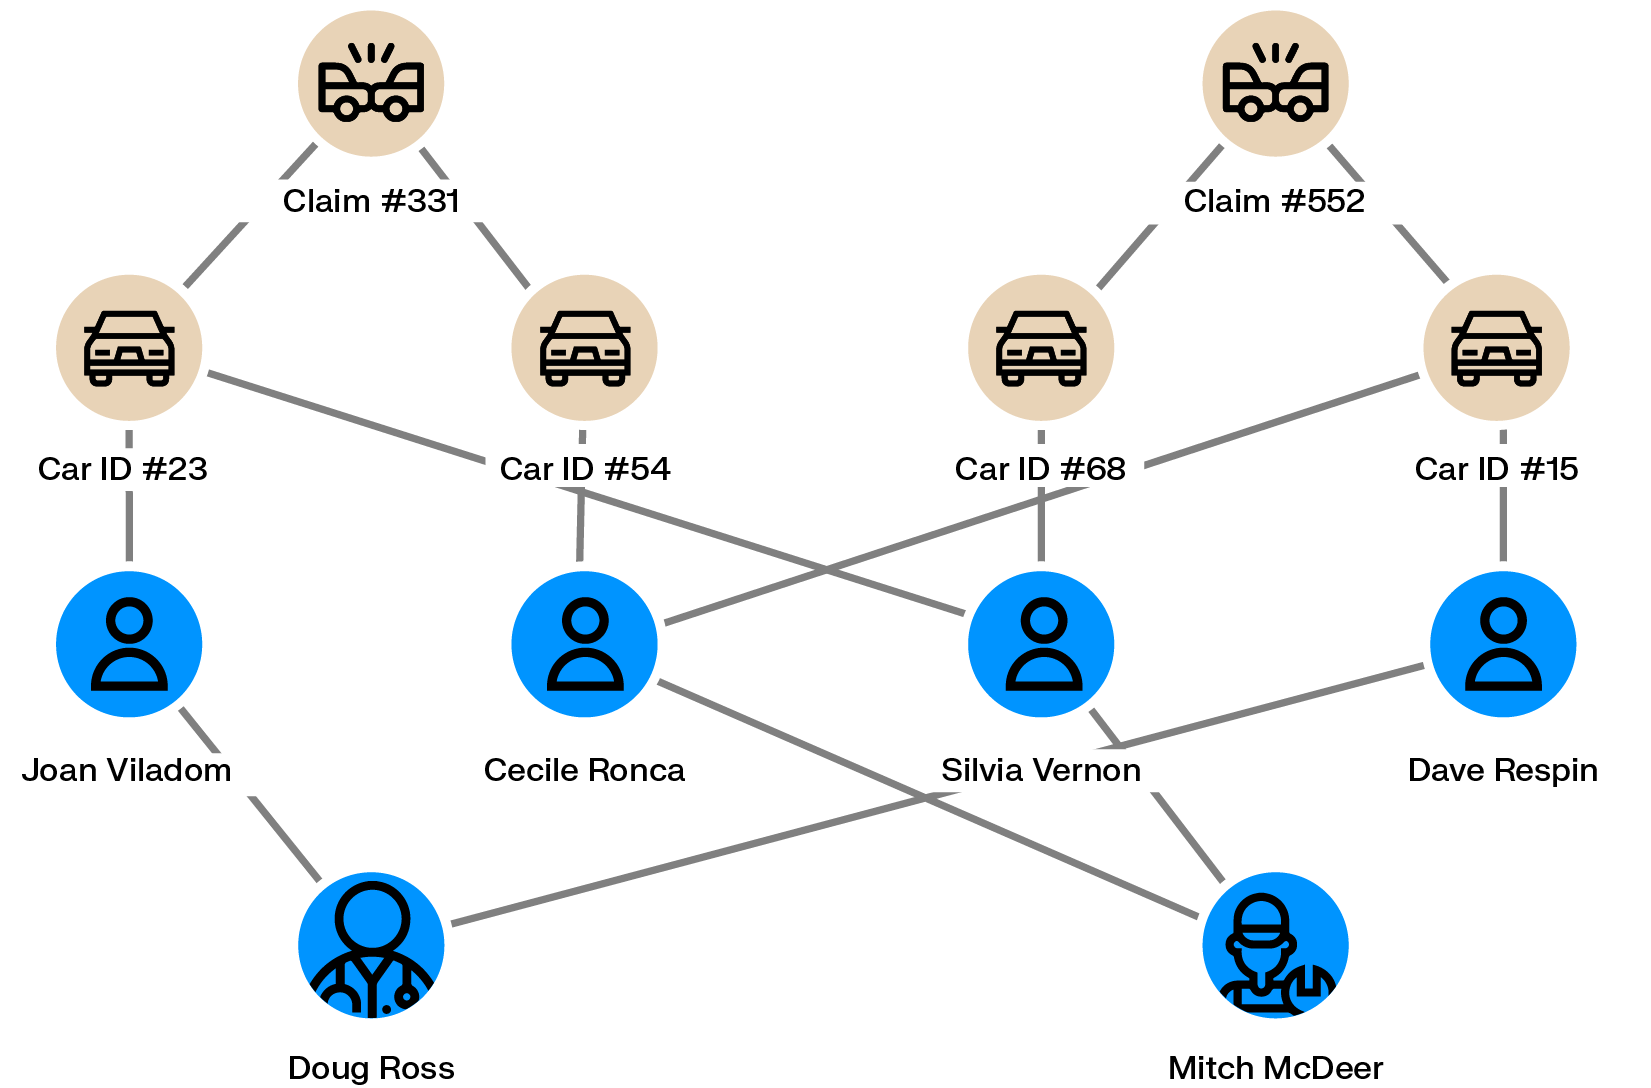
A typical scheme involves an individual taking out a policy, then filing a claim for an accident that never actually happened, usually with the cooperation of a complicit repair shop. Scaling that scheme to make it worthwhile requires multiple policyholders, multiple vehicles, and sometimes fabricated passengers, which is where the network starts to become visible.
Graph analytics can surface these patterns by mapping connections across people, vehicles, repair shops, and claims within an insurer's database. One fake claim might look like noise in isolation, but a dozen people sharing overlapping vehicles, addresses, and repair shops starts to look unmistakably like a coordinated operation.
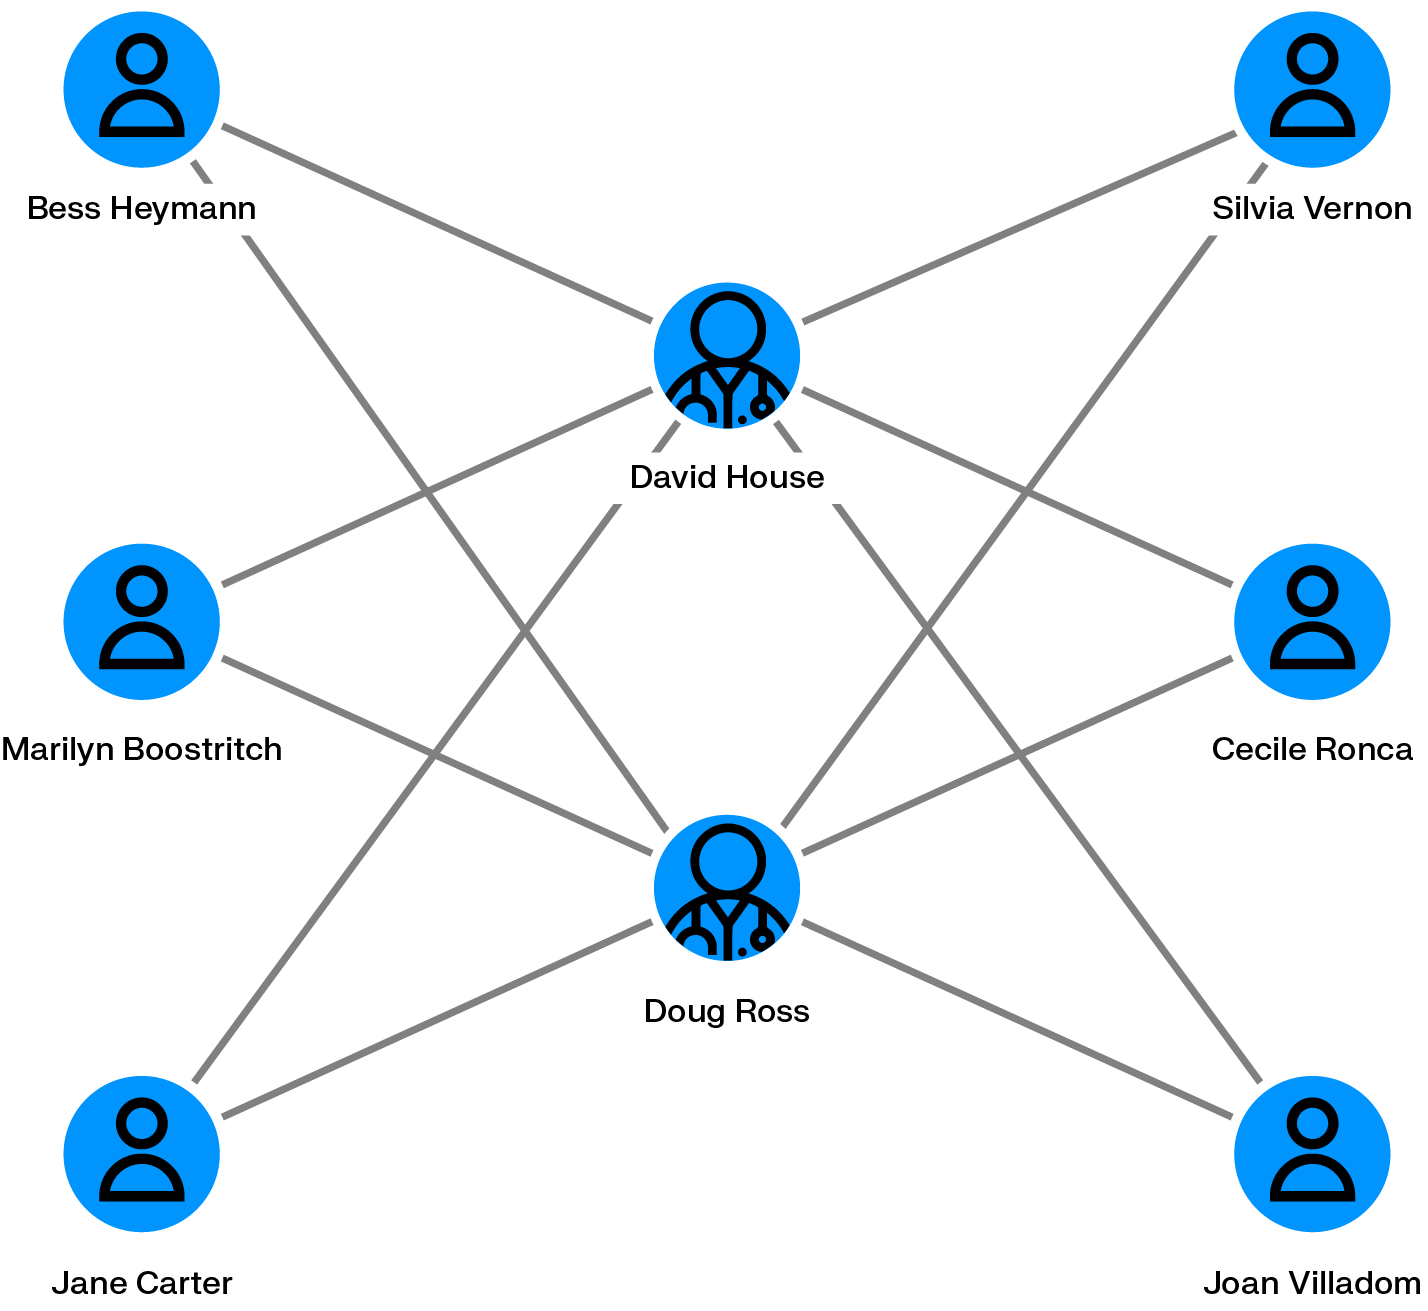
Medical providers have a range of options when it comes to defrauding a health insurer: billing for services never rendered, duplicating charges for the same procedure, or performing unnecessary treatments and passing the cost along. Health care insurance fraud is the most costly category of insurance fraud, costing US consumers an estimated $105 billion annually. The scale of enforcement action reflects just how serious this has become: in 2025, the National Health Care Fraud Takedown charged 324 defendants across the US, involving $14.6 billion in intended losses and seizing $245 million in assets.
Graph analytics helps analysts spot the anomalies that point to this kind of activity, things like patients appearing across multiple providers for identical procedures, medical professionals sharing an unusually high number of common patients, or a single doctor billing the same service repeatedly to the same individual. Those patterns don't always stand out when you're looking at rows in a spreadsheet, but in a graph view, the connections become immediately apparent.
Natural disasters create conditions that some contractors exploit. After a flood or hurricane, an inspector with bad intentions might bill for unnecessary repairs, knowing that homeowners are stressed, insurers are overwhelmed, and scrutiny is lower than usual. Property and casualty fraud costs increase by around 16% after natural disasters, which gives a sense of how significant the opportunistic element really is.
Graph analytics provides investigators with the ability to easily spot contractors frequently billing for the same services, or billing the same services multiple times. Graph-native investigation platforms like Linkurious Enterprise can also layer in geographic information to identify precisely where a natural disaster occurred - and see if a home claiming damage is located within that zone.
Life insurance fraud costs the US industry around $74.4 billion annually. The schemes range from applicants misrepresenting their health status to obtain better policy terms, to more elaborate operations where criminals use fabricated or stolen identities. Elder financial abuse is another growing concern, where trusted individuals manipulate older policyholders into making unauthorized changes to beneficiaries, bank accounts, or policy ownership.
Graph analytics helps investigators connect the dots across what can otherwise look like unrelated records. Fraudsters who create fake or stolen identities often reuse the same contact details—a phone number, an address, a bank account—across multiple policies to keep control of communications and payouts. Individually, none of those details raises an obvious flag. Mapped together in a graph view, the pattern becomes hard to ignore.
Workers’ compensation fraud can come from multiple directions at once, which is part of what makes it particularly difficult to detect. Employees may fabricate or exaggerate injuries to collect benefits while continuing to work elsewhere. Employers may misclassify workers or underreport payroll to reduce their premium payments. In more organized schemes, medical providers become complicit, billing for treatments that were never given to injured workers who may not even know their claim is being exploited.
Graph analytics makes these overlapping schemes much easier to spot. When a medical provider is billing across an unusually high number of unrelated claims, or when the full picture of a claimant’s connected data contradicts the injury they reported, those inconsistencies become visible the moment the connections are mapped together.
Zurich Insurance, Switzerland's largest insurer and a company operating across more than 215 countries and territories, put this approach to work within their Swiss account fraud team. Using Linkurious Enterprise alongside Neo4j, their analysts built an investigation workflow in a way that's considerably faster than what legacy methods had allowed them to do.
Their process is worth seeing in action. Watch the webinar replay to see a live demonstration of how Zurich approaches fraud detection and investigation from end to end.
The fraud landscape is shifting fast, and detection programs that worked five years ago are struggling to keep up. For insurers looking to move beyond legacy systems and fragmented data, the Insurance Fraud Handbook breaks down how a connected, graph-driven approach changes the way teams detect, investigate, and act on fraud.
A spotlight on graph technology directly in your inbox.