Linkurious has been helping technical and non-technical users make sense of their connected data for over ten years now. The roots of Linkurious are older, however, since its CEO has a long experience in the domain of graph technology. Sébastien Heymann, co-founder of Linkurious, was also one of the co-founders of Gephi back when he was an engineering student, before he started working on his PhD.
How did Gephi, the open source software for network visualization and analysis, get its start? And in what ways did it give rise to Linkurious? We did a Q&A with Sébastien to get the whole story.
Many people in the graph community are familiar with Gephi, but could you briefly describe it for folks who may be a little less familiar with the tool?
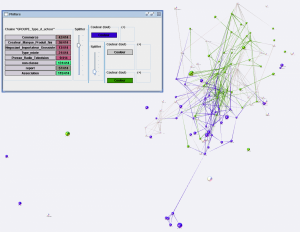
Gephi is a desktop-based open source graph visualization and exploration software, framed as the “Photoshop for graphs”. Users display and manipulate interactively networks up to 100,000 relationships. It is mostly used for social network analysis. The first prototype was built in 2006 by Mathieu Jacomy (read his interview here). Its foundational paper has been cited by 12,500 research papers since then, and received the Oracle Duke’s Choice Award 2010.
I was an engineering student when I joined the project in 2008, shortly after Mathieu Bastian became project lead and started the industrial development of the software to support the activities of Dana Diminescu's sociology research team at Maison des Sciences de l'Homme, Paris, and Franck Ghitalla's research on web cartography. No existing graph visualization tool fit their needs, so they built their own.
I joined the project because I was fascinated by networks and their potential to answer research questions that statistical methods cannot. I also simply loved making beautiful pictures, and Gephi made me feel a sense of wonder.
In 2007, graph databases didn't exist (Neo4j was a prototype), graph visualization existed commercially only for law enforcement and intelligence agencies and was called link analysis. All tools required scientific training.
Many open source tools existed for research scientists, but they were very hard to use (bad user interface, command-line only, buggy), and they produced static pictures.
Gephi was created to manipulate interactive graph visualizations by mouse for live exploration. Its breakthrough was a new node placement (layout) algorithm called ForceAtlas, it was possible to render the progress of the algorithm on screen in real time to get a feeling of how it applied the forces among nodes. It produced visually good results to explore both relationships and clusters of nodes.
The only users of Gephi at that time were its creators and a few researchers. My main mission was to evangelize scientific communities: to make other scientists aware of it, and use it if they liked the software as it was. My role was to build online and live communities of users, communicate about the software, create training content for online and live training of scientific communities, train people in various seminars, and help people use the tool. My technical contribution was limited to the co-creation of the GEXF graph file format.
My second mission was to secure our resources and assets. My role was to create and administer the NGO named Association Gephi that hosts the intellectual property rights, gets funds, and pays the bills.
I remember our first research conference in San Jose, CA, in 2009. At 23 years old, I was nervous and excited as it was my first time out of France. A researcher from IBM reads our poster, turns to me and asks this question: “You claim that your software is better than others, can you prove it?” After listening to my broken English, his simple answer started to make me believe in us: “I believe you, I'll download your software.” It was a powerful experience.

Being part of a collective project at the edge of (network) science was the most rewarding aspect. The most fulfilling activities for me were: a) evangelizing the scientific community by meeting sharp-minded people from San Francisco to Yekaterinburg, b) unblocking users on the support forum, and c) seeing the impact in their studies.
I'm proud of the community of users: it has grown far beyond our own capacities through word-of-mouth, people helping each other, recording tutorials, spreading the love of graphs, and even laughing at their failed attempts or software glitches. I believe that we exceeded our expectations on this part of the project considering our lack of marketing training and resources.
More than 12,500 scientific publications cite the original Gephi paper, which received the International AAAI Conference on Web and Social Media (ICWSM) “Test of Time” award in 2019.
I believe that its enduring success is rooted in the successful collaboration between social scientists and software engineers that sparked innovation, a core team that worked tirelessly during years to develop it and iterate based on both their internal use of the tool and listening to community feedback, and a tool that was very enjoyable and powerful to use despite its steep learning curve and frustrating bugs. It's also free, an important aspect for an academic audience.
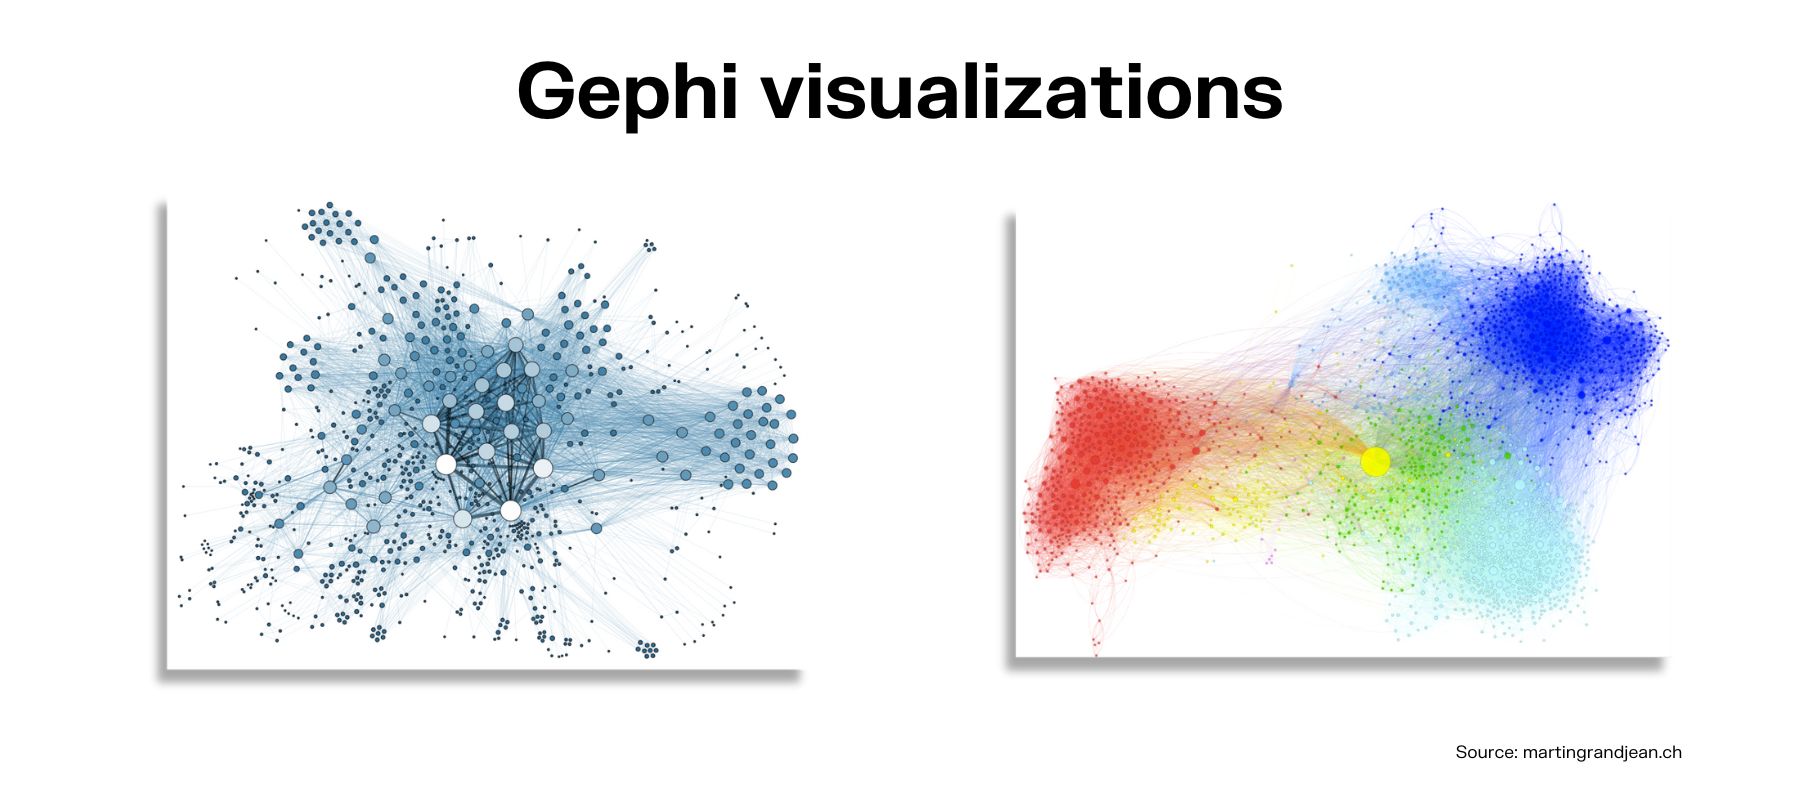
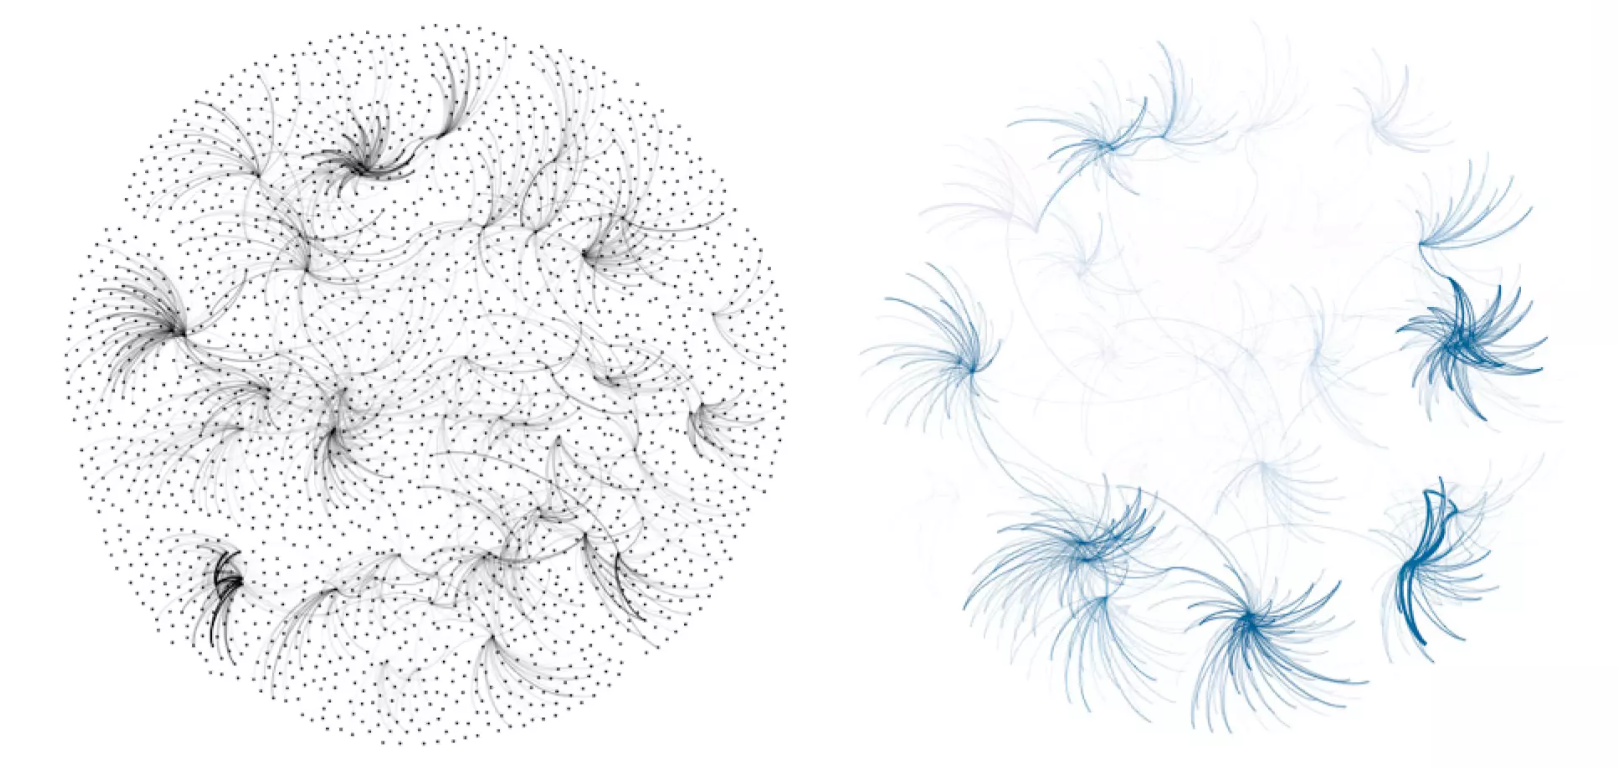
Maybe more importantly, many users shared screenshots online to communicate intermediary results, catching attention with beautiful visualizations.
The software development of Gephi stopped in 2013 in a sad state unfortunately, as the project members turned to other priorities. My proposal to develop an open source business model, enabling us to hire software engineers, had been rejected, so I looked at other ways to create a company related to graph visualization during the last year of my PhD under the supervision of Bénédicte Le Grand at Sorbonne Université. I am thankful to her for supporting my project!
1. Global vs local data exploration:
Finding insights is difficult in Gephi for non-data experts because of its underlying approach to data exploration: users load full graph datasets, display big hairballs, then try to make sense of them by navigating between the macro level and the micro level via a combination of interaction techniques (layouting, zooming, adding visual cues based on statistics). This approach is great for the characterization of complex datasets by scientists. But it is strongly limited by cognitive capabilities, expertise in data analysis, and computing power.
I envisioned a different way to lower the cognitive and skills barriers. It was based on a local exploration from a search query and expansion/contraction of the view with local neighbors on demand. This approach proved to be more suited for data-driven investigations and business intelligence, because only a subset of data is needed for such tasks, and irrelevant data is visual noise that slows down the analyst.
This approach contributes to the field of Exploratory Data Analysis, whose main goal is to speed up the formulation of novel questions and relevant hypotheses about data through serendipitous findings.
2. Scientific vs business users:
Gephi contributed to democratizing graph analytics within scientific communities, but it was difficult to use. With Linkurious I wanted to go beyond science and reach business users. They have no or little data skills, yet they have unanswered questions and have an increasing need to make data-driven decisions.
Web browsers were emerging as the new technology platform to build and deploy complex applications. While Gephi is a desktop application with a rigid user interface, we can build more usable interfaces in Web applications, and better support non-technical users.
3. Non-funded vs funded organization:
The creators of Gephi decided to put the project to sleep in 2013 instead of building an organization that could hire software engineers. It resulted in unfixed bugs for more than a decade, lack of investment in its core rendering technology, and a community left alone. It is an understandable decision, and a reminder that software never exists in vacuum, and it needs key people and engineers who envision it and shape its future.
I wanted financial independence to build an innovative and robust graph exploration technology, so it was clear to me that Linkurious had to be a for-profit organization.
An organization is alive as long as its members are driven by the same vision and agree on the same definition of success. I've carefully chosen my two co-founders Jean Villedieu and David Rapin. We're still actively working together, passionate about graphs, 12 years on.
How was the process of founding Linkurious different from working on Gephi? Did working on commercial software open up some more possibilities for innovation?
Both projects are born out of a rendez-vous between social sciences and software engineering. Their uniqueness is based on a disruptive opinion on how to explore data visually. For Gephi, the visual representation should be directly manipulable (like malleable matter) and layout algorithms that shape the graph visually should behave transparently using immediate visual feedback. For Linkurious, the graph should be explorable progressively and the visualization expanded locally from an initial search query.
Gephi was first and foremost an internal project, a tool built for the needs of the scientists and engineers who created it, then it happened that it could also be used by other scientists and was more suitable than the alternatives for some research communities. Iterations were fast because we tested it directly on our use cases while rooting its principles into scientific theories of data visualization, notably the Semiology of Graphics of Jacques Bertin. It ceased to be developed when its creators didn't need to fix or develop features. It is considered a legacy software, still actively used despite the lack of improvements and disconnect with modern hardware capabilities. Now a small community of volunteers gather around its founders from time to time to maintain it.
Linkurious has been a commercial project from the start: its license fees were used to bootstrap the company at the end of my PhD so we could quickly work full-time on it, and those fees informed us on product-market fit. We sold a single-user prototype that anyone could buy online with a credit card and install on their laptop. Customers, by “voting with their money”, encouraged us and gave feedback that we used for iterating on the software.
By investing more than 10 m€ in R&D over time, we've introduced to the market the first graph exploration and analytics software for business users, Linkurious Enterprise. We've been first to introduce key features for the local exploration of graph data, such as the integration of a text search engine with graph databases, node neighborhood expansion, query templates, contextual actions, and more recently schema-agnostic alerts based on graph patterns, to enable the detection of structural anomalies during continuous monitoring. The regular use of Linkurious Enterprise by 10,000 analysts today shows that there was an underserved market for visual graph analytics software that Gephi didn’t and couldn’t address.
Curious to know more about how Linkurious and Gephi are different? What type of users each tool is for?
We published a second article in this series that takes a deeper look at how the two graph visualization softwares differ. Read it here.
A spotlight on graph technology directly in your inbox.