Software architecture can quickly grow quite complex, and that complexity can make development projects cumbersome to visualize and manage. And poorly managed dependencies can result in unanticipated blockers, project slowdowns, security risks, and general frustration for the teams working on these projects.
Software dependency graphs help you understand the complexity of all the individual components tied to a project and bring it under control. Using graph visualization technology to modelize and analyze software dependencies can help you anticipate blockers and bottlenecks so your teams can work more efficiently. We’ll take a look at exactly how that works further on in this article. First, let’s do a quick overview of software dependency graphs.
Almost every software program has third-party dependencies. As a software project grows with new features, software dependencies grow as well. And with increased dependencies, the project becomes more complex to manage. Some organizations manage multiple projects. In those cases, the code may be split in several modules across different teams, which may be geographically distributed. This makes “legacy” software dependencies and their size an even more serious problem.
For the reasons mentioned above, developers introducing new software dependencies should always check if they will conflict with existing ones or if a former version of the same library is already in use. Change requests over core legacy code must be carefully analyzed to understand all the pieces of code that would be impacted by such a change.
Laying out software dependencies helps developers understand the impact of changes made to one component on the other parts of the development ecosystem (more on that a little bit later). Gaining this understanding is essential when updating or replacing software components. It also helps identify potential issues and prevent system failures.
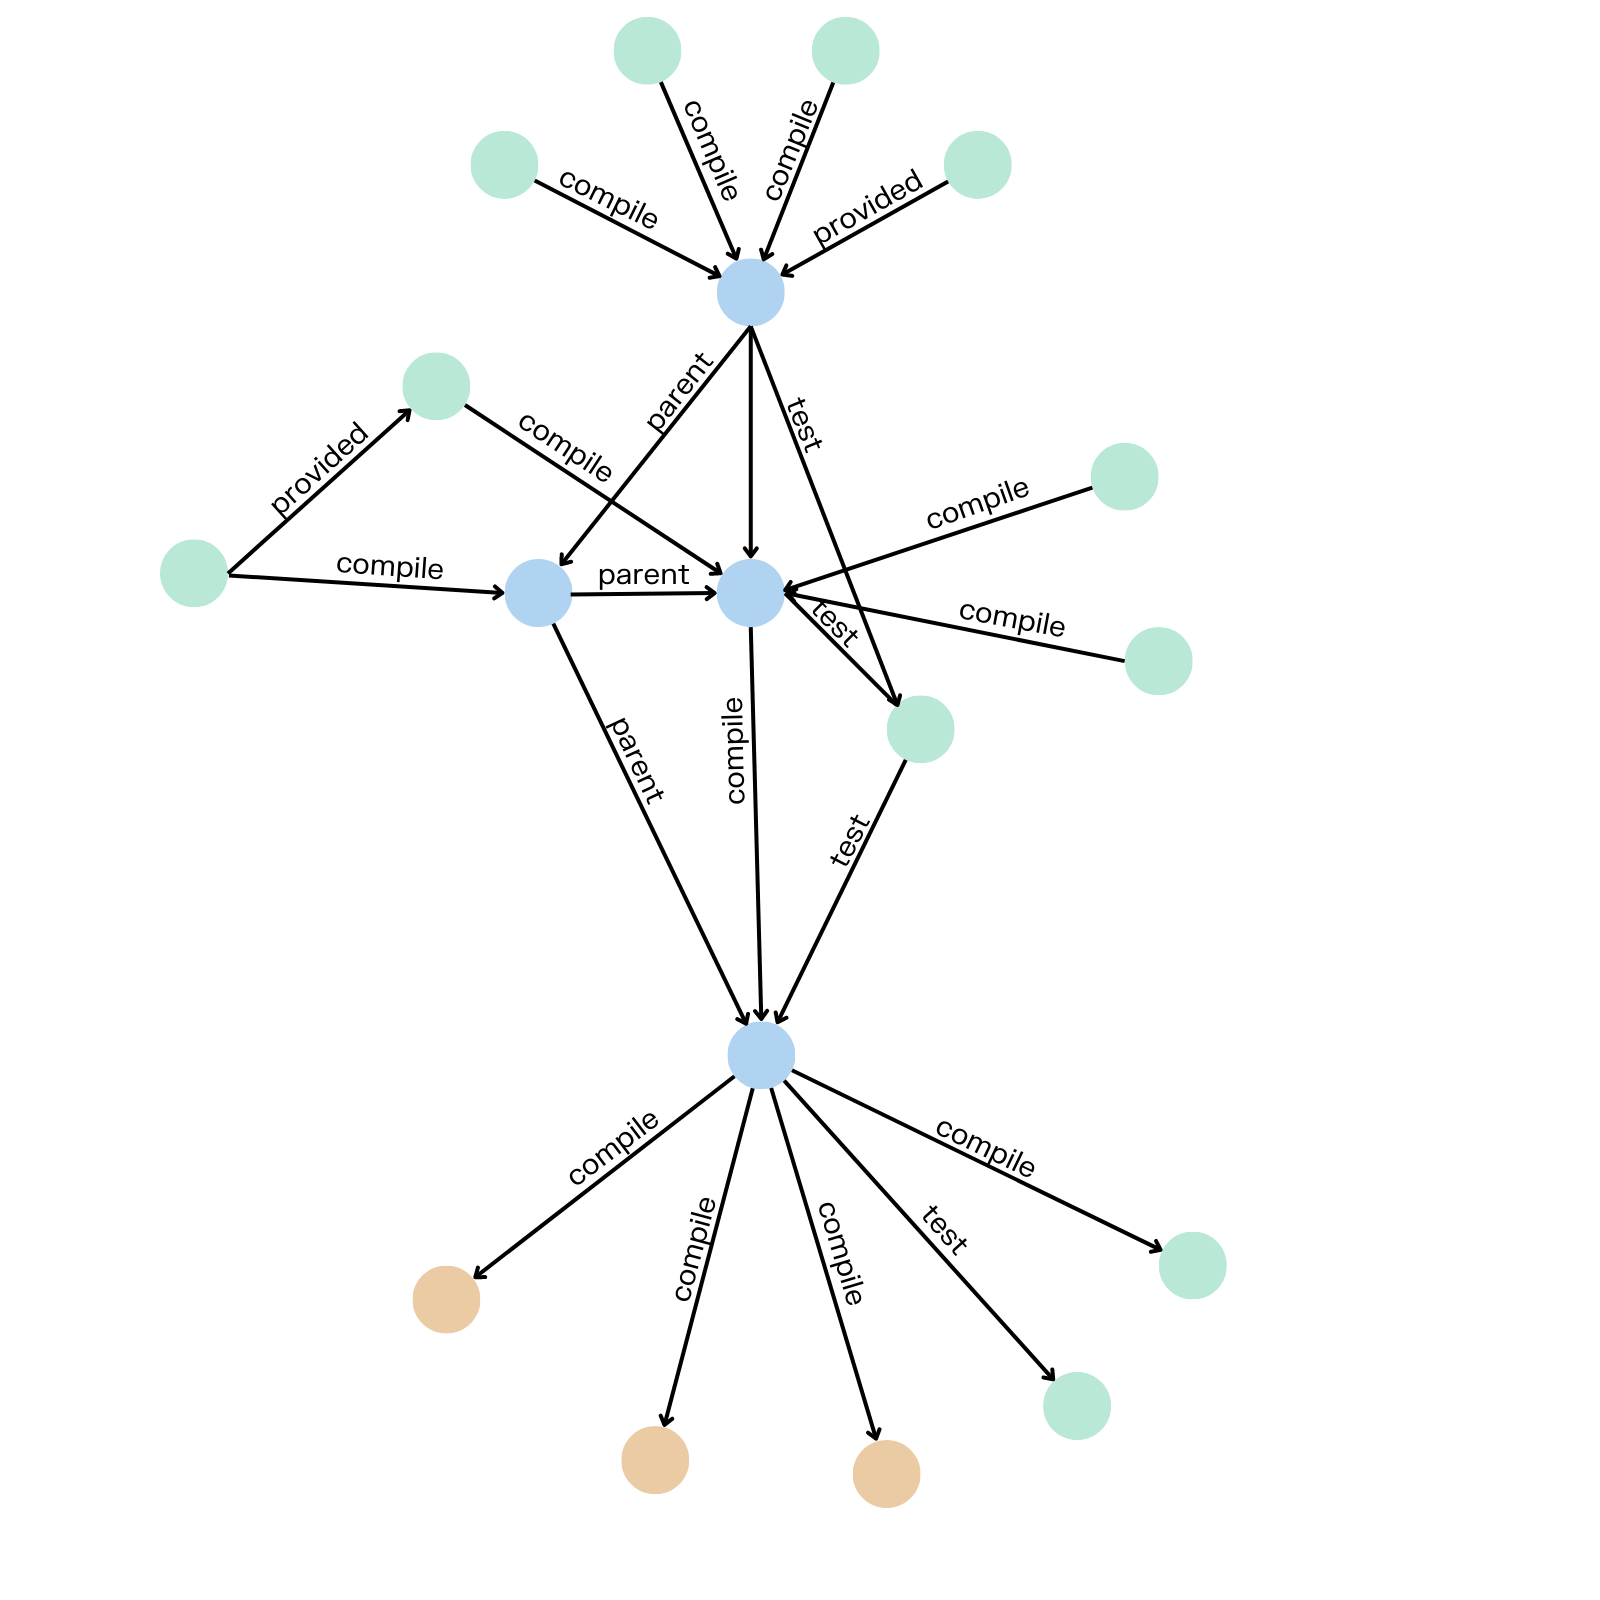
A software dependency graph is a directed graph that shows the relationship between different modules, libraries, frameworks, etc. within a software system. Each component in a software dependency graph is represented as a node, and the directed edges represent the dependencies between those components. Here’s a very simple example of a software dependency graph:
Having a reliable tool to visualize and analyze software dependencies helps reduce the effort to create and maintain a graph manually, and ensures it remains up to date with an evolving software system.
Graph structures data as nodes - individual entities - and edges, which represent the relationships between the nodes. Because relationships take center stage in a graph data model, network visualization and graph analytics are particularly well suited to understanding and analyzing software dependencies.
In the context of software dependency analysis, nodes represent individual software components or modules, and edges represent how those components relate to each other. Graph visualization gives you a full view over all relationships - both direct and indirect - so you can see each dependency that may cause conflicts.
Graph visualization presents several advantages for developers and IT professionals to manage their software dependencies. A graph doesn’t have a strict schema, giving you flexibility and making it easy to integrate new data. That flexibility also helps break down data silos. Graph visualization tools are also highly scalable, meaning they can be used on large datasets with hundreds or even thousands of elements without any noticeable performance degradation. You can map even the most vast and complex IT and software ecosystems using graph visualization.
Let’s take a look at how this applies in the case of performing impact analysis.
If your development ecosystem is large enough, you may struggle to evaluate the impact a code modification may have over other teams’ code. Changing a method behavior, even in an apparently insignificant way, can wreak havoc on your organization if you are not completely sure about which other projects are invoking such methods and why. Just imagine adding a couple of log lines to increase execution feedback, just to discover (usually too late) that your method is used in several time-critical applications where the few milliseconds of delay introduced by printing logs are causing deadlines to be missed.
There are several ways graph analytics can help with impact analysis to avoid this kind of problem. Here are some examples of how.
Graph algorithms such as shortest path or all-pairs shortest path can be used to analyze the path between different components in the graph. This can help determine the dependencies between components and identify which components are most impacted by changes to other components.
Graph analytics can identify clusters of software components that have strong connections between them. These clusters can represent different software modules or subsystems, and analyzing them can help identify which modules are most impacted by changes to other modules.
Graph analytics can analyze the impact of changes to the software system by identifying the nodes and edges that will be affected by the changes. This can help developers understand the potential impact of their changes before they are implemented, and help them identify any potential issues or risks.
CAST provides products that generate software intelligence, with a technology based on semantic analysis of software source code and components. Their technology automatically "understands" custom-built software systems and provides insights into their inner workings with MRI-like precision.
To achieve greater software intelligence, CAST turned to Ogma, an all-in-one JavaScript library for large-scale graph visualizations. By leveraging graph technology, mapping different software dependencies becomes much easier and faster to use and gain real insights from. It provides a powerful and flexible way to model, analyze, and visualize complex relationships between software components. In fact, one CAST client even noted that what once was taking 3-4 days to accomplish could now be done in just 3-4 hours.

A spotlight on graph technology directly in your inbox.