Risk scoring: Why context matters, and how graph analytics delivers it
Risk scoring is an important piece of the puzzle for organizations to effectively manage all kinds of risk. It’s a type of data scoring that lends a quantifiable weight to various risk factors, helping organizations make informed decisions about where to focus their attention and resources.
Calculating risk carries high stakes. The difference between an accurate risk assessment and a missed threat can mean millions of dollars in losses, regulatory penalties, or reputational damage. When these risk scores feed into automated workflows for decision-making and investigations, they become even more powerful tools for proactive risk management.
With the evolution of advanced analytics and decision intelligence technology, risk scoring has become more sophisticated and actionable than ever before. Modern risk models can incorporate graph analytics, analyzing and assessing complex relationships between data points. The result: a more contextual understanding of risk that goes beyond traditional scoring methods.
Risk scoring is a systematic method for evaluating and quantifying potential risks based on multiple criteria. Risk scoring typically involves giving different weights to various factors depending on how much they contribute to the overall risk calculation. A couple of examples of risk scoring could be:
- A cybersecurity risk score might weigh recent suspicious login attempts more heavily than the age of a user account
- A credit risk score might prioritize recent payment history over the length of credit history.
Risk scoring systems aren't static—they should evolve as new risk factors emerge and as organizations learn more about what drives actual risk in their specific context. Regular updates help maintain accuracy and relevance.
Risk scoring provides benefits that make it an important aspect of modern risk management strategies.
- Accurate risk identification. Without a systematic approach to scoring, organizations may instead rely on intuition or incomplete information. The result? Missed threats or false alarms.
- More efficient resource allocation. Instead of trying to address every potential threat equally, organizations can direct their attention and budget toward the highest-scoring risks, maximizing the impact of their risk management efforts.
- Better decision making. Whether you're deciding which security alerts to investigate first, which suppliers to audit, or which loan applications to approve, risk scores provide a data-driven, objective foundation for these choices.
- Preventing reputational damage often depends on catching and addressing risks before they escalate into public incidents.
Risk scoring has found applications across plenty of industries, with each sector adapting the concept to address their specific challenges and regulatory requirements.
Financial institutions use credit scores to evaluate the likelihood that a borrower will default on a loan. These scores consider factors like payment history, current debt levels, length of credit history, and types of credit accounts. The standardization of credit scoring has made lending more efficient and fair, while helping consumers understand how their financial behavior affects their borrowing options.
Understanding supply chain risks has become increasingly important as global supply chains grow more complex and interconnected. Organizations evaluate suppliers based on factors like financial stability, geographic location, regulatory compliance, and past performance. Recent global events (geopolitical turbulence, quickly evolving tariffs, Covid-19) have highlighted how disruptions in one part of the supply chain can cascade throughout entire industries, making effective supply chain risk scoring more important than ever.
Risk scoring in the context of cybersecurity helps teams prioritize their response to threats and vulnerabilities. These scores might consider factors like the significance of affected systems, the likelihood of exploitation, the potential impact of a successful attack, and the current threat environment. With thousands of security alerts generated daily in large organizations, risk scoring is essential for focusing attention on the most dangerous threats.
While the specific factors that determine risk scores vary significantly by industry and use case, most scoring systems follow a similar framework that considers both the likelihood and potential impact of threats.
The likelihood component examines how probable it is that a risk will actually materialize. This might involve analyzing historical data, along with context related to current conditions or leading indicators that suggest whether a threat is becoming more or less likely. For example, a cybersecurity risk score might increase the likelihood rating if it detects multiple failed login attempts or unusual network traffic patterns.
The impact component assesses what would happen if the risk does occur. This includes both direct costs and indirect consequences like regulatory penalties, business disruption, or reputation damage. A supply chain risk assessment might consider not just the cost of finding alternative suppliers, but also the potential revenue loss from production delays.
Most scoring systems combine these components using mathematical formulas that reflect the organization's risk tolerance and priorities. Some organizations multiply likelihood and impact scores, while others use more complex weighted formulas that account for additional factors like specific context relevant to the organization or use case.
Traditional risk scoring often treats each entity or event as an isolated data point, but this approach misses important context that comes from understanding how different elements connect and influence each other. Graph data science offers a more sophisticated approach by analyzing connected data and incorporating relationship information into risk calculations.
Graph data science examines networks of relationships between entities—people, organizations, transactions, devices, etc. Instead of looking at each piece of information in isolation, it considers how entities influence each other through their connections and interactions.
This relationship-based approach can reveal hidden patterns and risks that traditional risk scoring methods might miss. For example, a seemingly low-risk individual might become high-risk when you discover they're closely connected to known fraudsters. Similarly, a supplier might appear financially stable in isolation but pose significant risk when you see they're part of a network of companies that all depend on the same vulnerable sub-supplier.
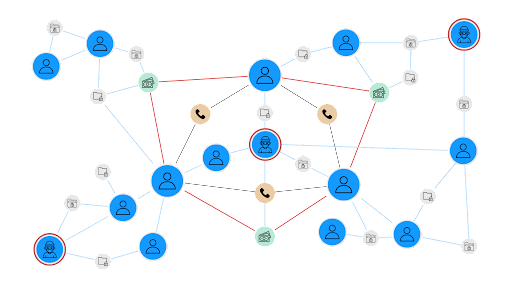
By adding context and revealing indirect relationships that might influence risk, graph analytics provides several advantages for risk scoring over traditional approaches.
- Network effects become visible when you analyze connected data. A risk that appears minor when viewed in isolation might prove significant when you consider how it could spread through a network.
- Indirect risk propagation becomes measurable through graph analysis. Traditional scoring might miss how risks can travel through networks of relationships.
- Pattern recognition improves dramatically when you can analyze entire networks rather than individual data points.
- Dynamic risk assessment becomes more contextual as graph algorithms can update risk scores in real-time as new connections form or existing relationships change.
- Explainability increases as the full context around high-risk entities or patterns becomes visible as a graph.
Linkurious Enterprise brings the power of graph analytics to risk scoring through its pre-processing feature, making network-based risk assessment accessible, practical, and actionable for risk management experts and data scientists.
Data pre-processing is a specific step in alerts within Linkurious where you can execute graph queries and write the result to the graph within the configuration panel. Data pre-processing lets you go from graph query to an ongoing and automated data enhancement process in just minutes. Data pre-processing results can then be directly used to generate alerts in Linkurious Enterprise, making them immediately actionable.
This approach extends traditional risk scoring by performing network-based calculations that consider relationship context and indirect risk factors.
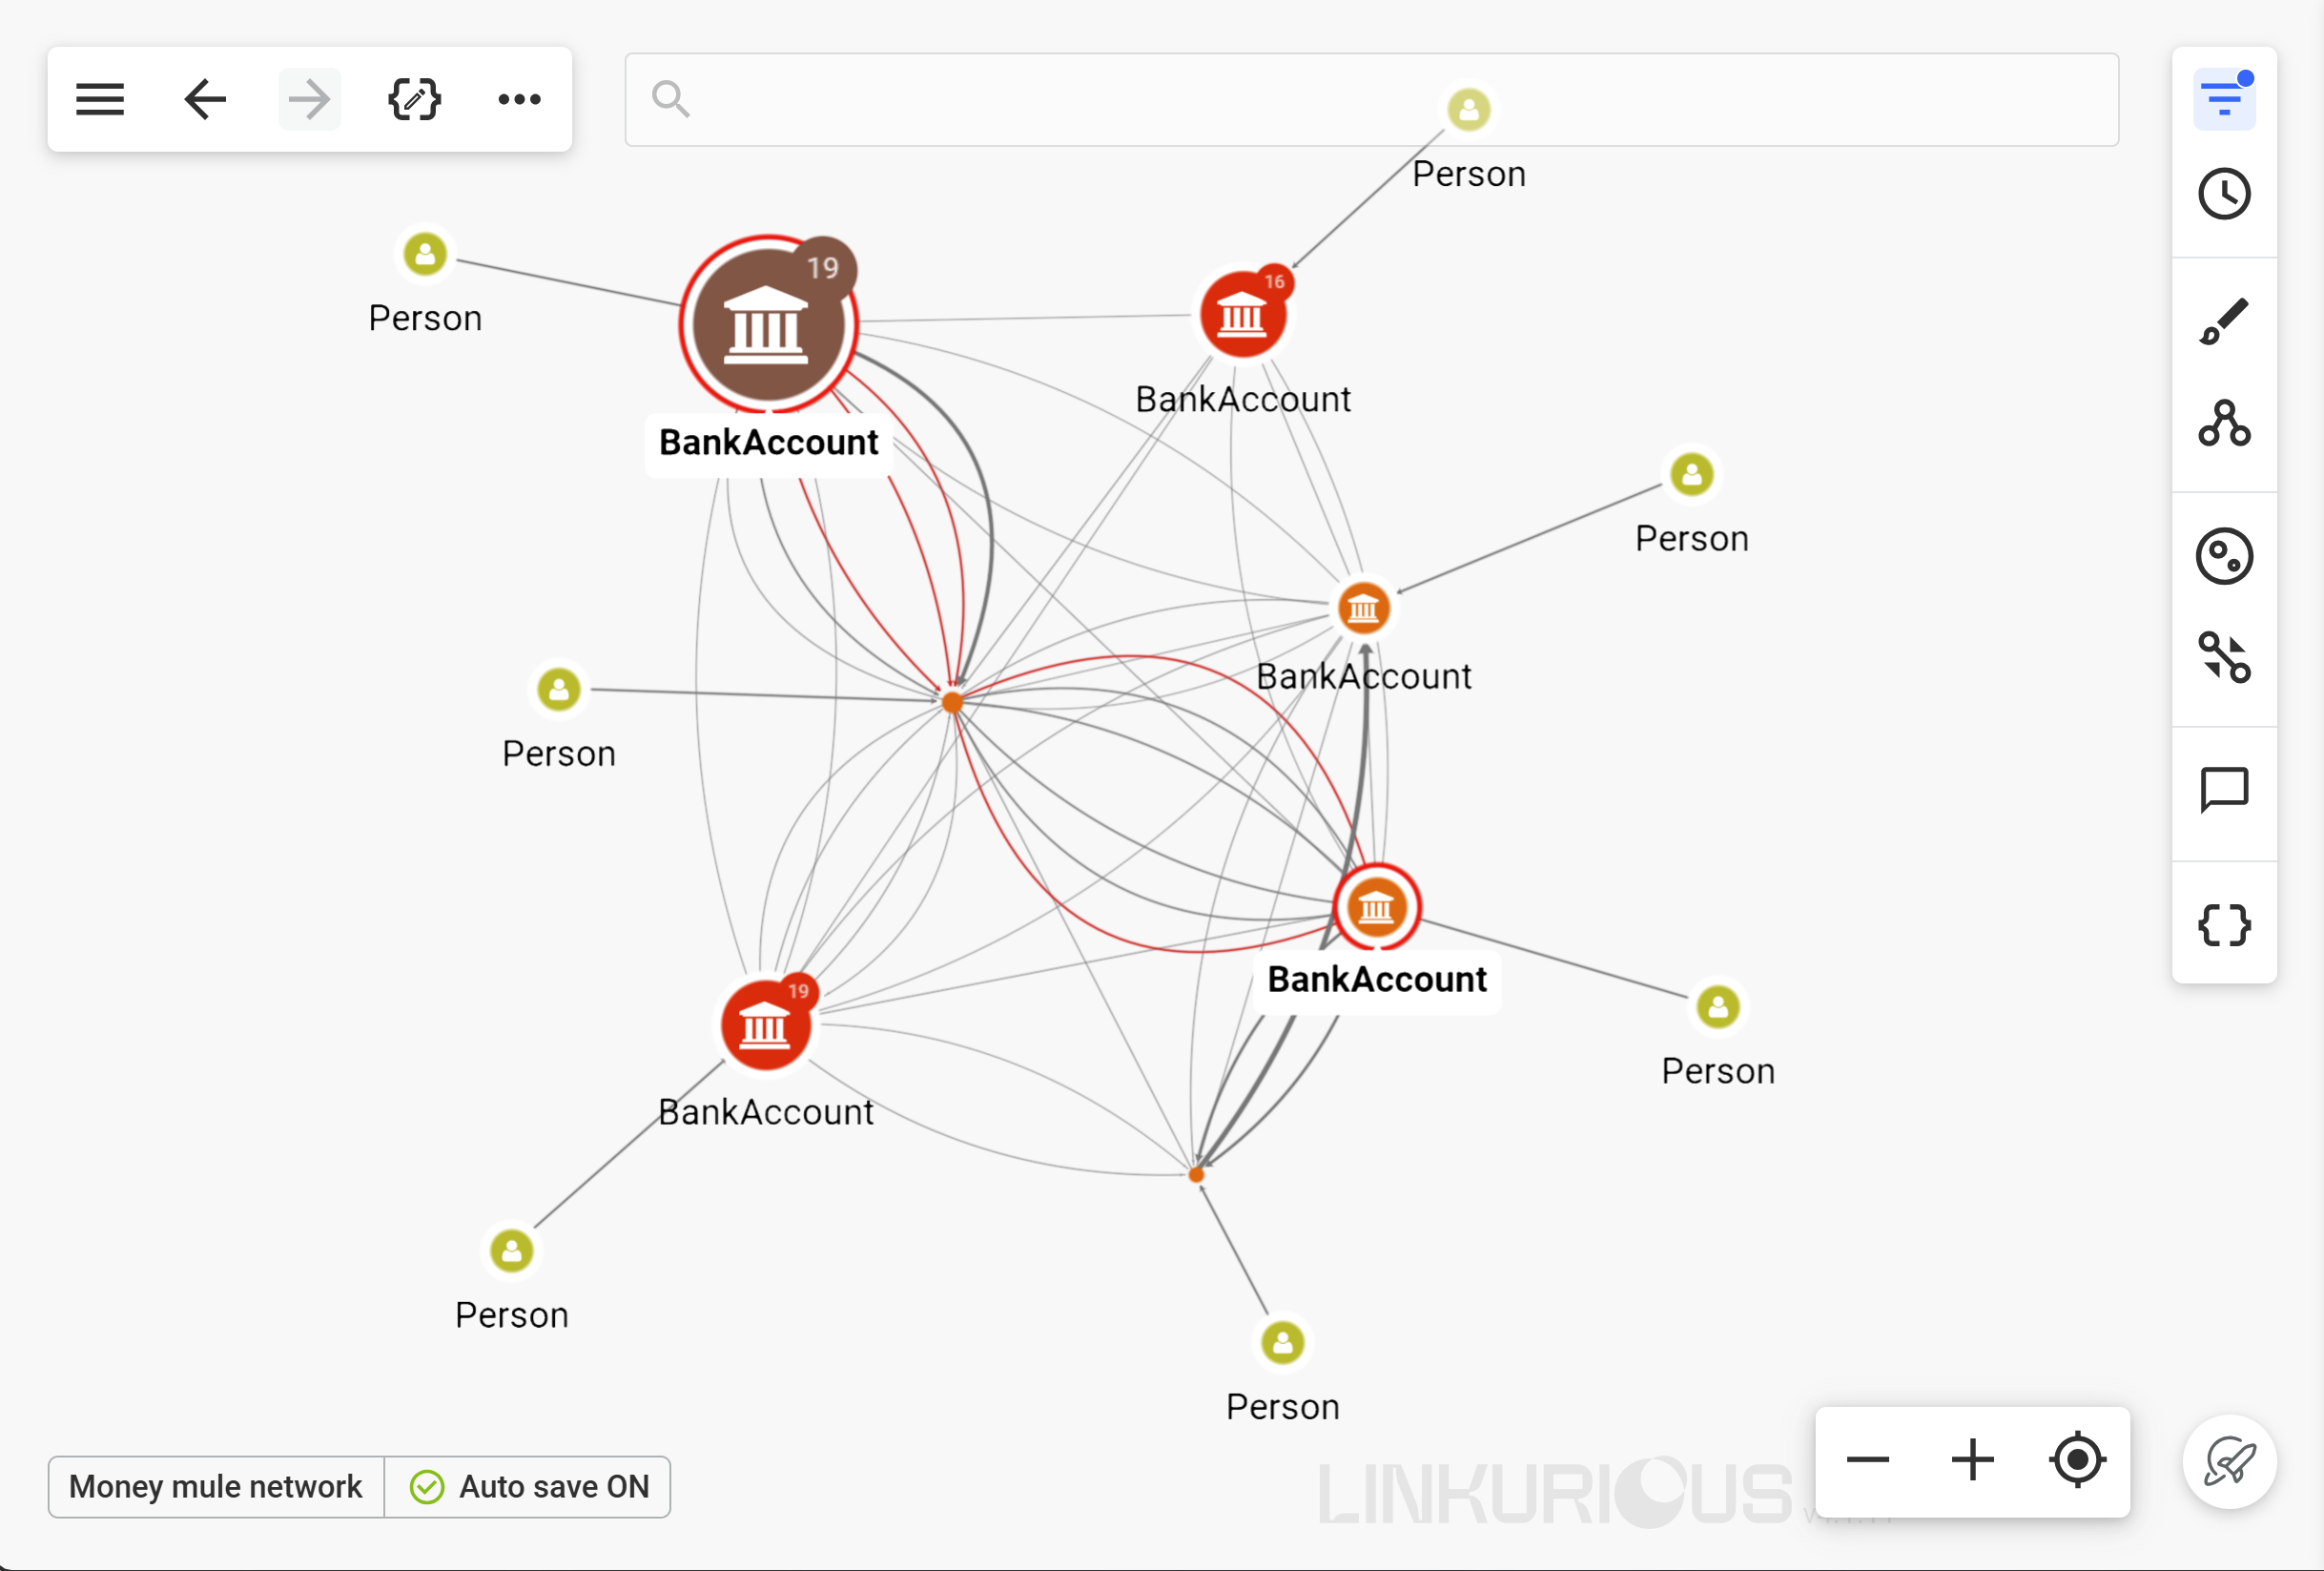
In this example, we’ll use data pre-processing to evaluate the likelihood of an account being part of a money mule operation. Specific connections and patterns—rather than isolated behaviors or incidents—tend to raise red flags for mule fraud, making this an interesting use case for network-based risk scoring.
First, we can evaluate which accounts have a high centrality score with a betweenness query. The higher the score, the more likely a given account might be a “hub” in a fraudulent network:
WITH 'lke-betweeness' AS g
// Clear any previous faulty execution
CALL { WITH g CALL gds.graph.drop(g, false) YIELD graphName }
CALL {
  WITH g
  CALL gds.graph.project(
    g,
    ['*'],
    ['*']
  ) YIELD graphName
  CALL gds.betweenness.write(g, { writeProperty: 'betweenness_score'}) YIELD nodePropertiesWritten
  RETURN nodePropertiesWritten
}
CALL { WITH g CALL gds.graph.drop(g) YIELD graphName }
RETURN 0;
As a second data pre-processing step, you can run a community detection algorithm. Doing this builds on the scoring done in the first step, identifying risky communities around the potential hub account and producing a risk score for a risky network rather than an individual account in isolation.
WITH 'lke-louvain' AS g
// Clear any previous faulty execution
CALL { WITH g CALL gds.graph.drop(g, false) YIELD graphName }
CALL {
  WITH g
  CALL gds.graph.project(
    g,
    ['*'],
    ['*']
  ) YIELD graphName
  CALL gds.degree.write(g, { writeProperty: 'louvain_score'}) YIELD nodePropertiesWritten
  RETURN nodePropertiesWritten
}
CALL { WITH g CALL gds.graph.drop(g) YIELD graphName }
RETURN 0;
After scoring your data using data pre-processing in Linkurious Enterprise, your riskiest accounts or networks will appear in the case list, where you can open them as a visualization and investigate further.
Data pre-processing brings the power of context-based risk scoring to your graph analysis and investigation, bringing your more context, faster.
To learn more about the ins and outs of data pre-processing in Linkurious Enterprise, or to learn how you can get started on graph investigation, get in touch today.

A spotlight on graph technology directly in your inbox.