It takes a team: Collaborative graph visualization and analytics capabilities with Linkurious Enterprise
The adoption of graph technology is growing quickly among organizations working across a wide variety of use cases. Previously, the use of graph had been reserved to a small number of visionary data professionals. No longer.
Today, teams adopting graph include many types of users, from entry level analysts to advanced technical users. When dealing with complex, connected data, it can take a whole team to analyze that data and make informed decisions. Take the example of the Panama Papers. Hundreds of journalists working with the ICIJ collaborated to surface hidden - and groundbreaking - insights.
And even in a well established AML compliance process, several experts may need to investigate and make decisions on the most difficult cases.
With the democratization of graph technology, collaboration features have become a must-have for graph visualization and analytics tools. Teamwork and collaboration within these tools should also be effortless, enriching rather than hindering your projects.
Within Linkurious Enterprise, we’ve rolled out a suite of features to facilitate team collaboration so everyone can access exactly what they need and stay up to date. Read on to see how teamwork features in Linkurious Enterprise can help your graph projects run like a well oiled machine.
Strong, clear communication is essential to successful teamwork. With the release of Linkurious Enterprise 4.0, we have doubled down on the product features to help the collaboration within your team run smoothly.
Whether you’re investigating a potential case of money laundering or evaluating your cybersecurity defenses, multiple members of your team will need access to Linkurious Enterprise and to certain visualizations.
Linkurious Enterprise gives you the possibility to collaborate directly on your graph visualizations, while also managing user access on a broader scale.
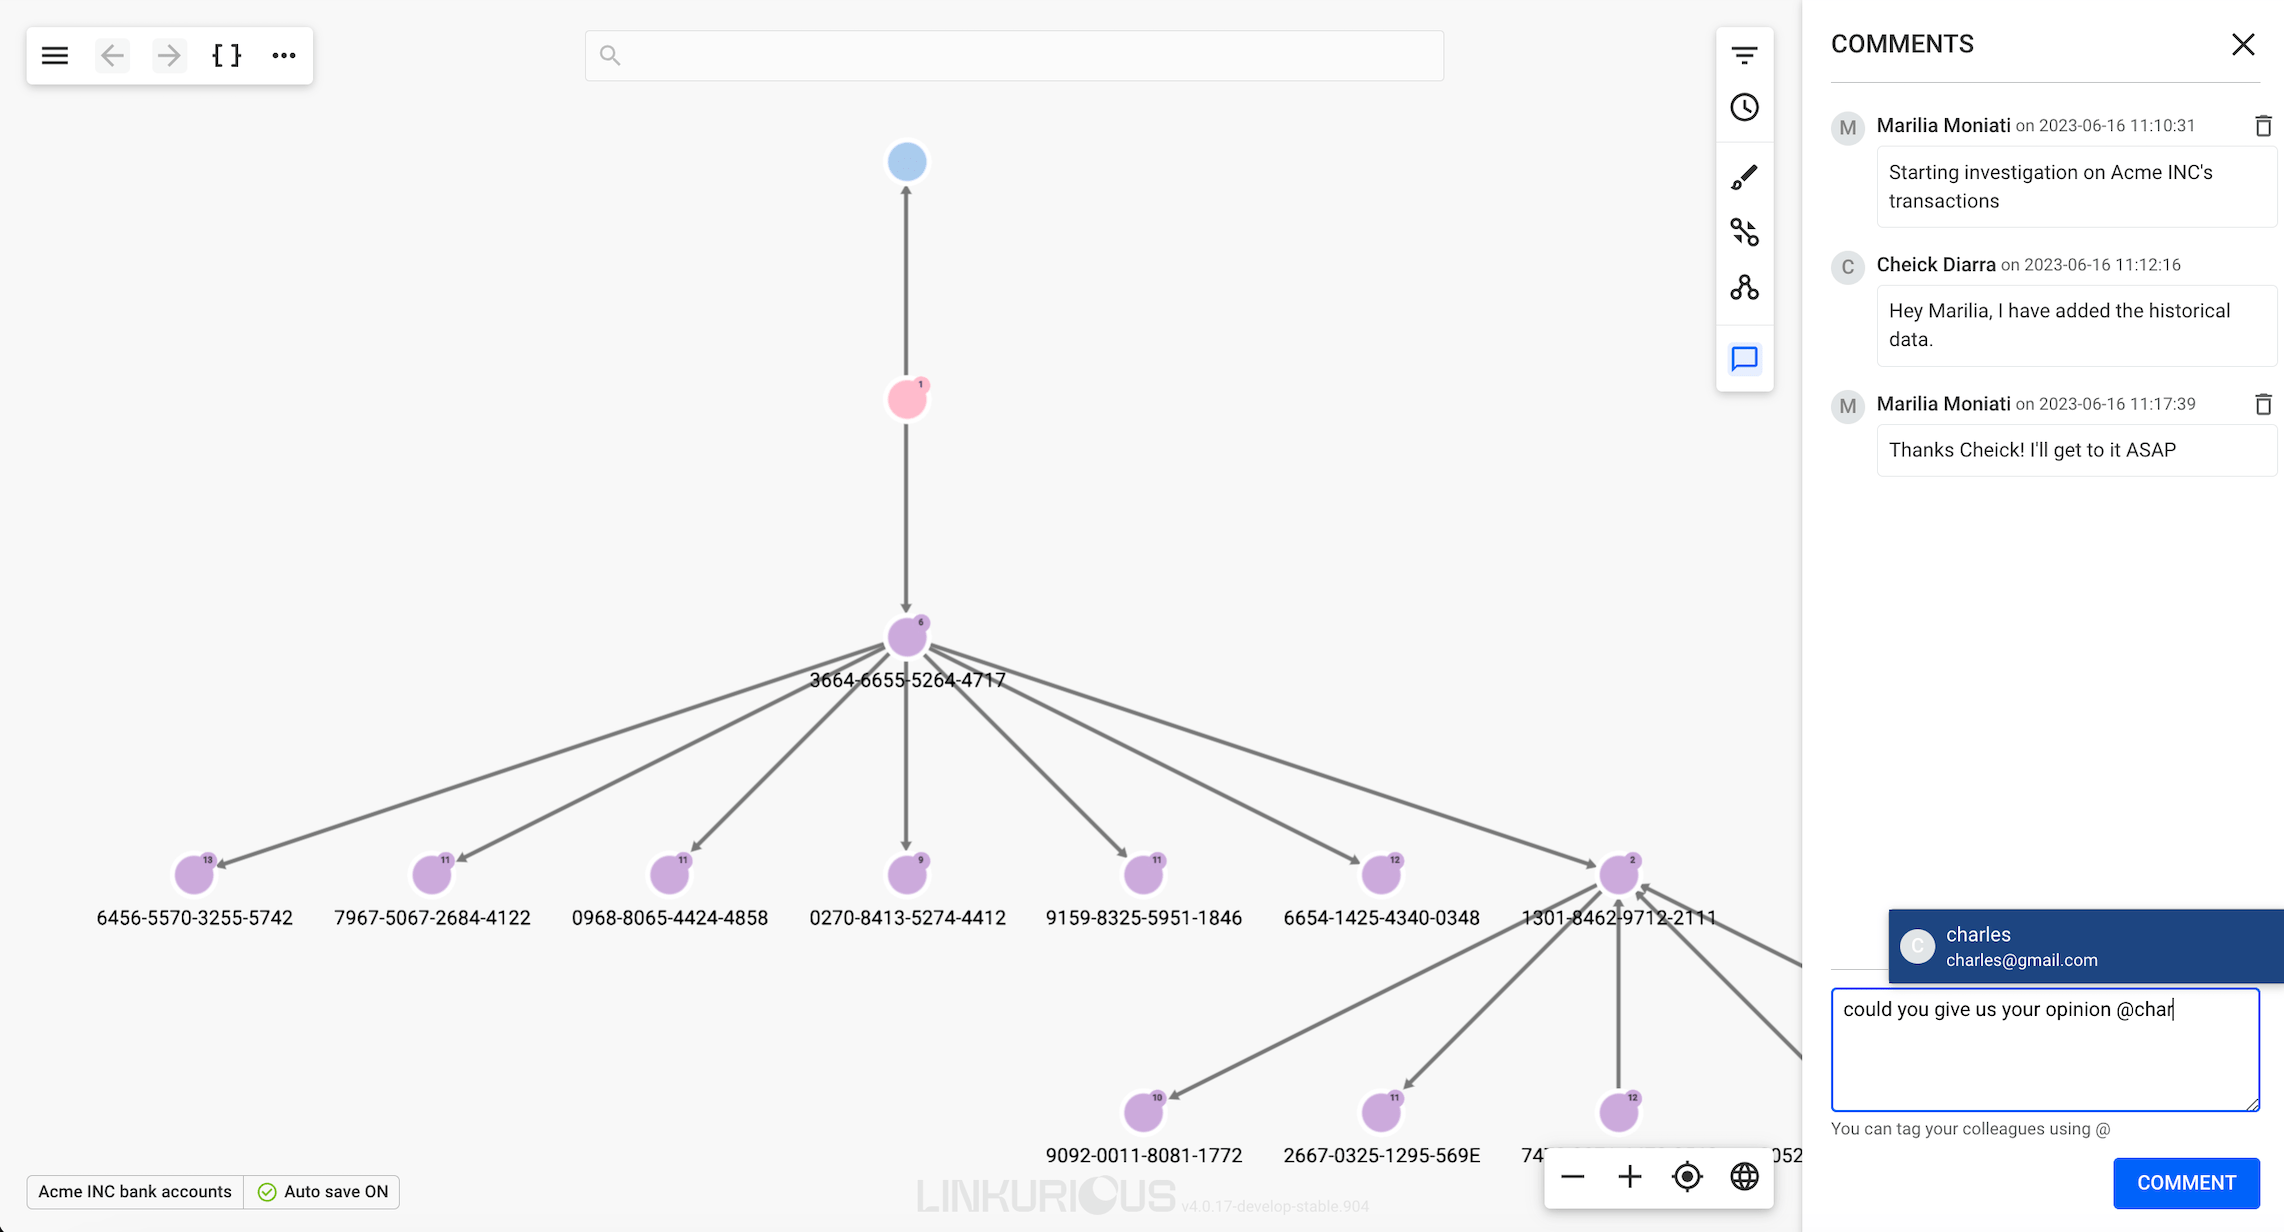
Graph visualizations in Linkurious Enterprise now have comments and tagging features. Leave your analysis in a comment, let a colleague know something is ready for their review, ask for a second opinion or a confirmation, and more. Comments also enable you to describe your investigation or add additional context. All directly within your visualizations. Anyone tagged in a comment receives an email notification so they can stay up to date in real time.
You can also collaborate on the creation and maintenance of powerful investigation tools like queries and custom actions.
Users belonging to built-in “Admin” and “Source Manager” groups can edit and delete any queries and custom actions that are shared with at least one group. Users belonging to custom groups also have this ability.
For example, the following query has been created by Gustavo, was shared with a group of users by Carl, and has been edited by Mary.
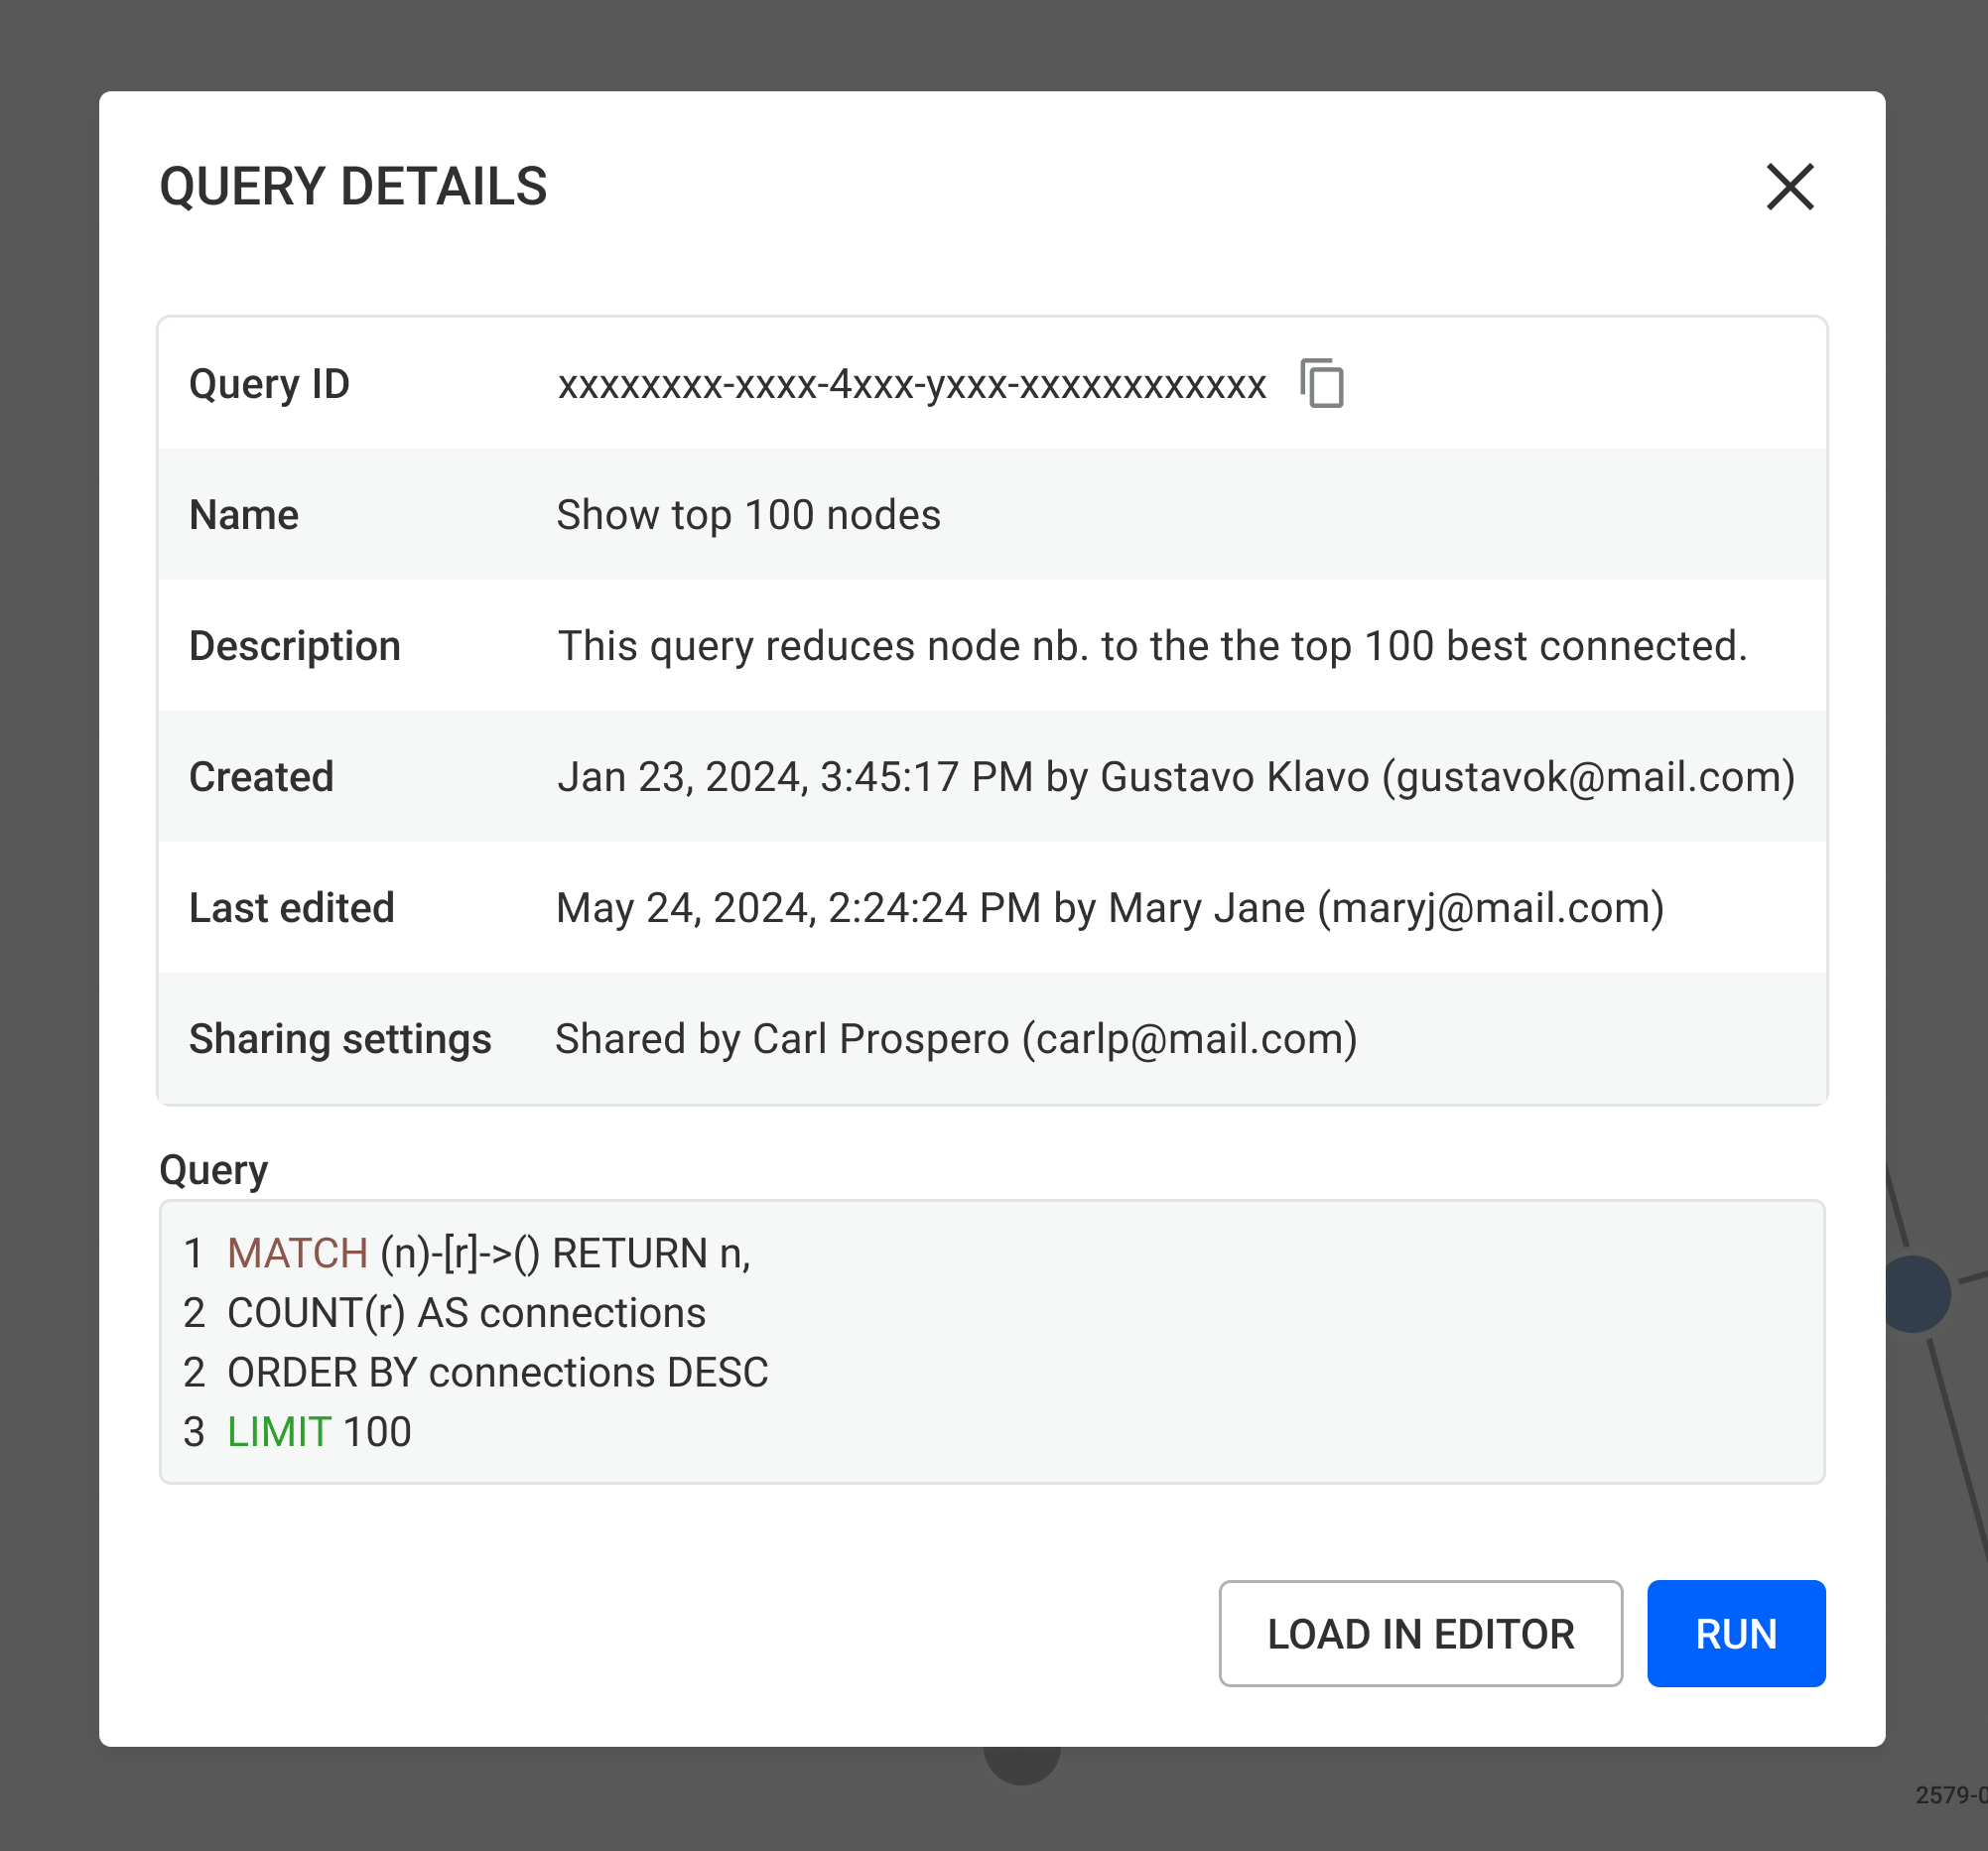
Editing a query or custom action is useful for continuity, for example when the creator is on vacation or has left the team.
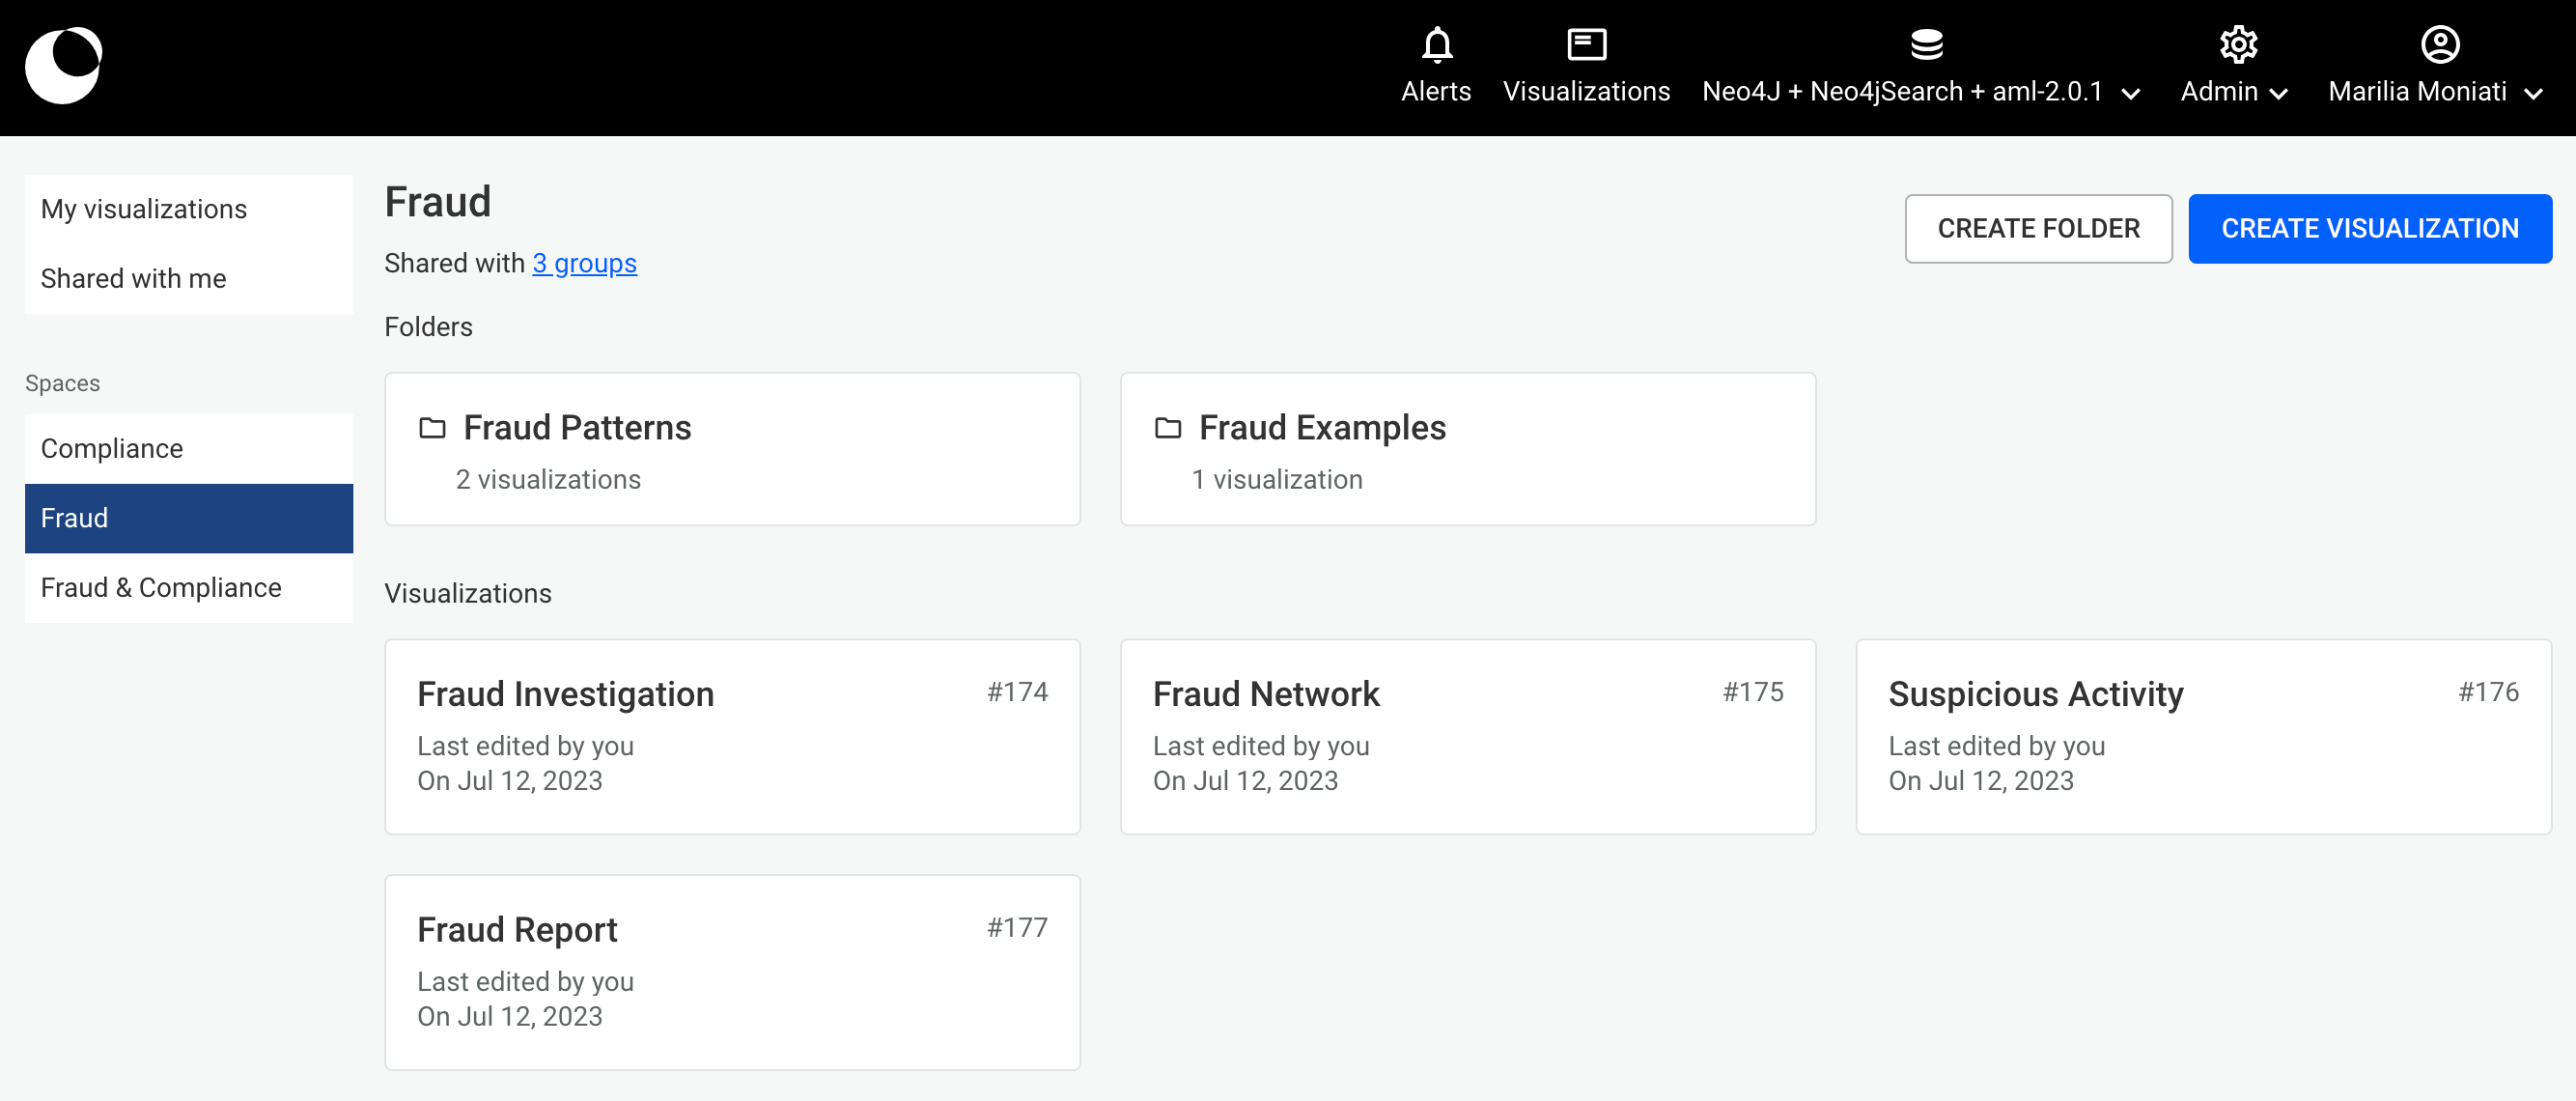
You also have different options to define who can see your visualizations in Linkurious Enterprise. You can decide to share visualizations individually with whoever needs to see them within your team or organization. You can also set up a Space where new visualizations will automatically be shared with the group of people who have been given access to that Space.
The Spaces feature also enables you to manage groups of visualizations as folders. Spaces allows for multiple teams to collaborate on common objectives and facilitates cross-team exchange on ongoing projects. They also allow you to better manage the onboarding and off-boarding of users without loss of work history, visualizations, queries, etc.
Alerts in Linkurious Enterprise are made for collaboration by design. There are several key teamwork features to ensure your detection and investigation processes run smoothly.
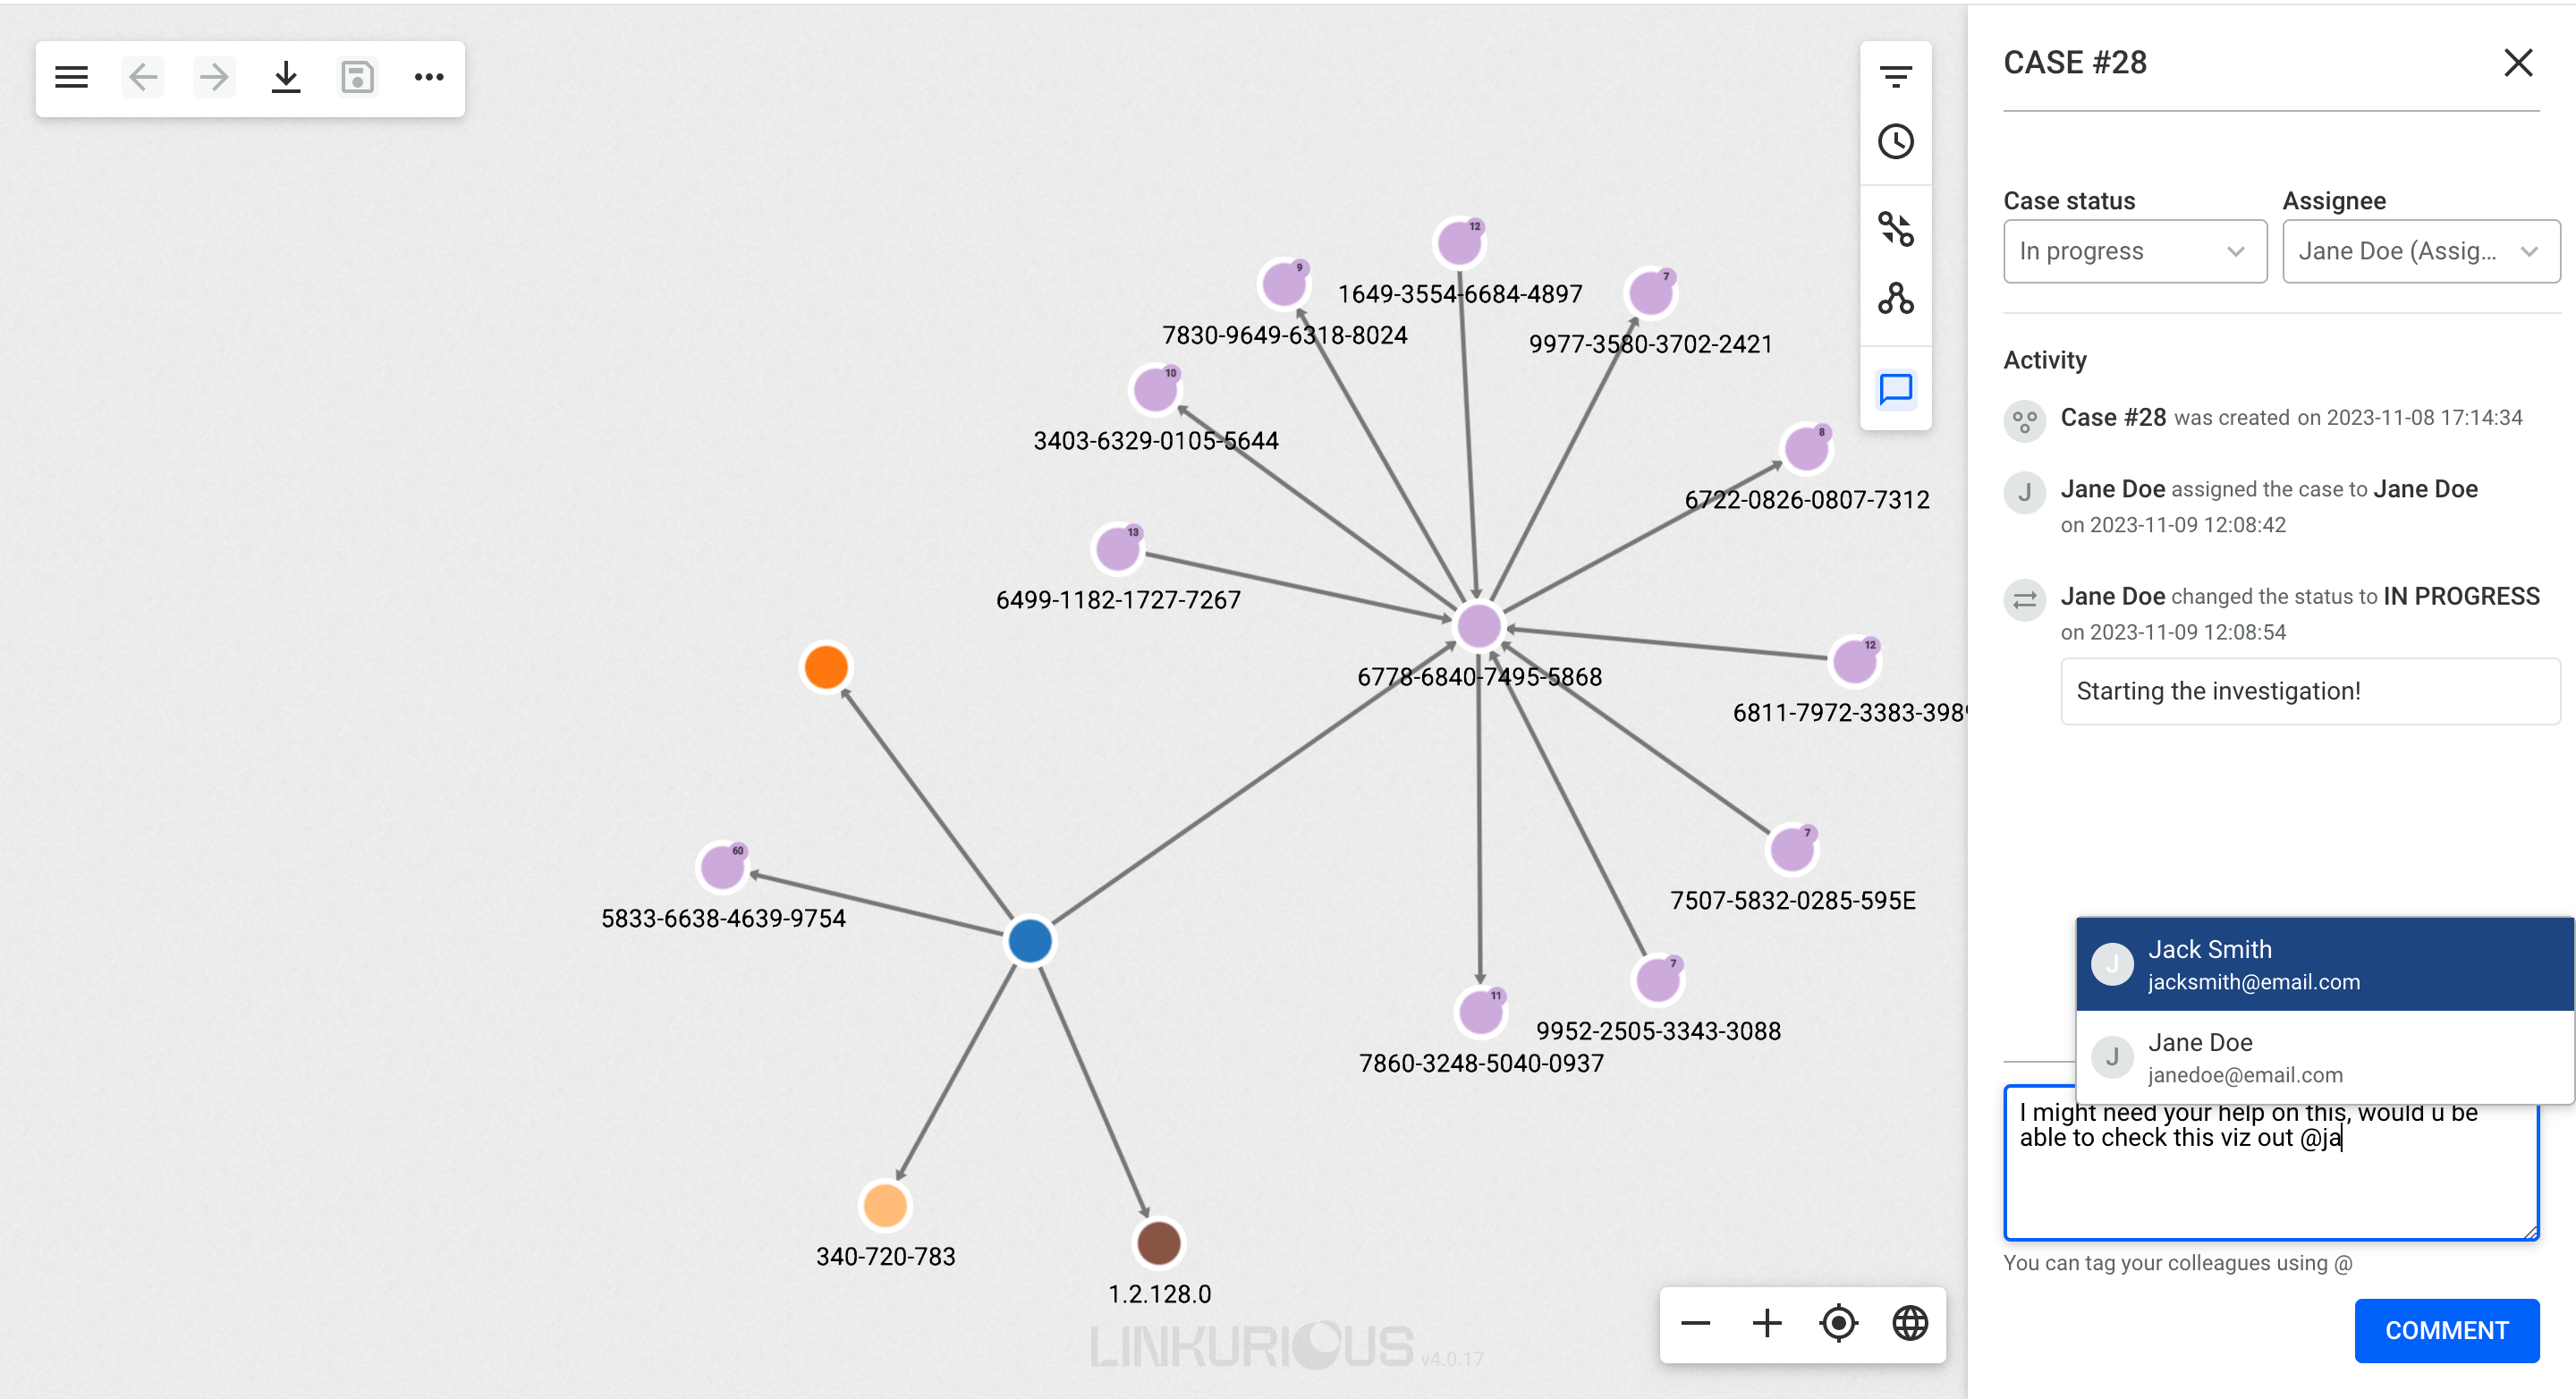
Once you’ve set up your alerts and they start turning up positive matches, those hits are transformed into cases that appear in the unified case list. This allows managers to have a single, unified view of all cases generated within Linkurious Enterprise to assess their team’s workload and dispatch as necessary.
Each case can be assigned to an individual to organize the work generated by alerts. You can change the case assignee to escalate it or request input from a colleague. Cases can be filtered by assignee, facilitating caseload management.
Like in visualizations, you can comment on cases to give additional context or comment on case progress. You can also tag individual team members if you need to alert them to something, ask them for input, etc.
Email notifications ensure everyone stays updated. Case digests flag new cases associated with your alerts. Email notifications can also be configured for case assignments and mentions in comments.
Sometimes people outside of your organization - partners, consultants, or other organizations - or collaborators in other company departments will need access to certain visualizations or to certain data. We have developed plugin and widget features to simplify external sharing.
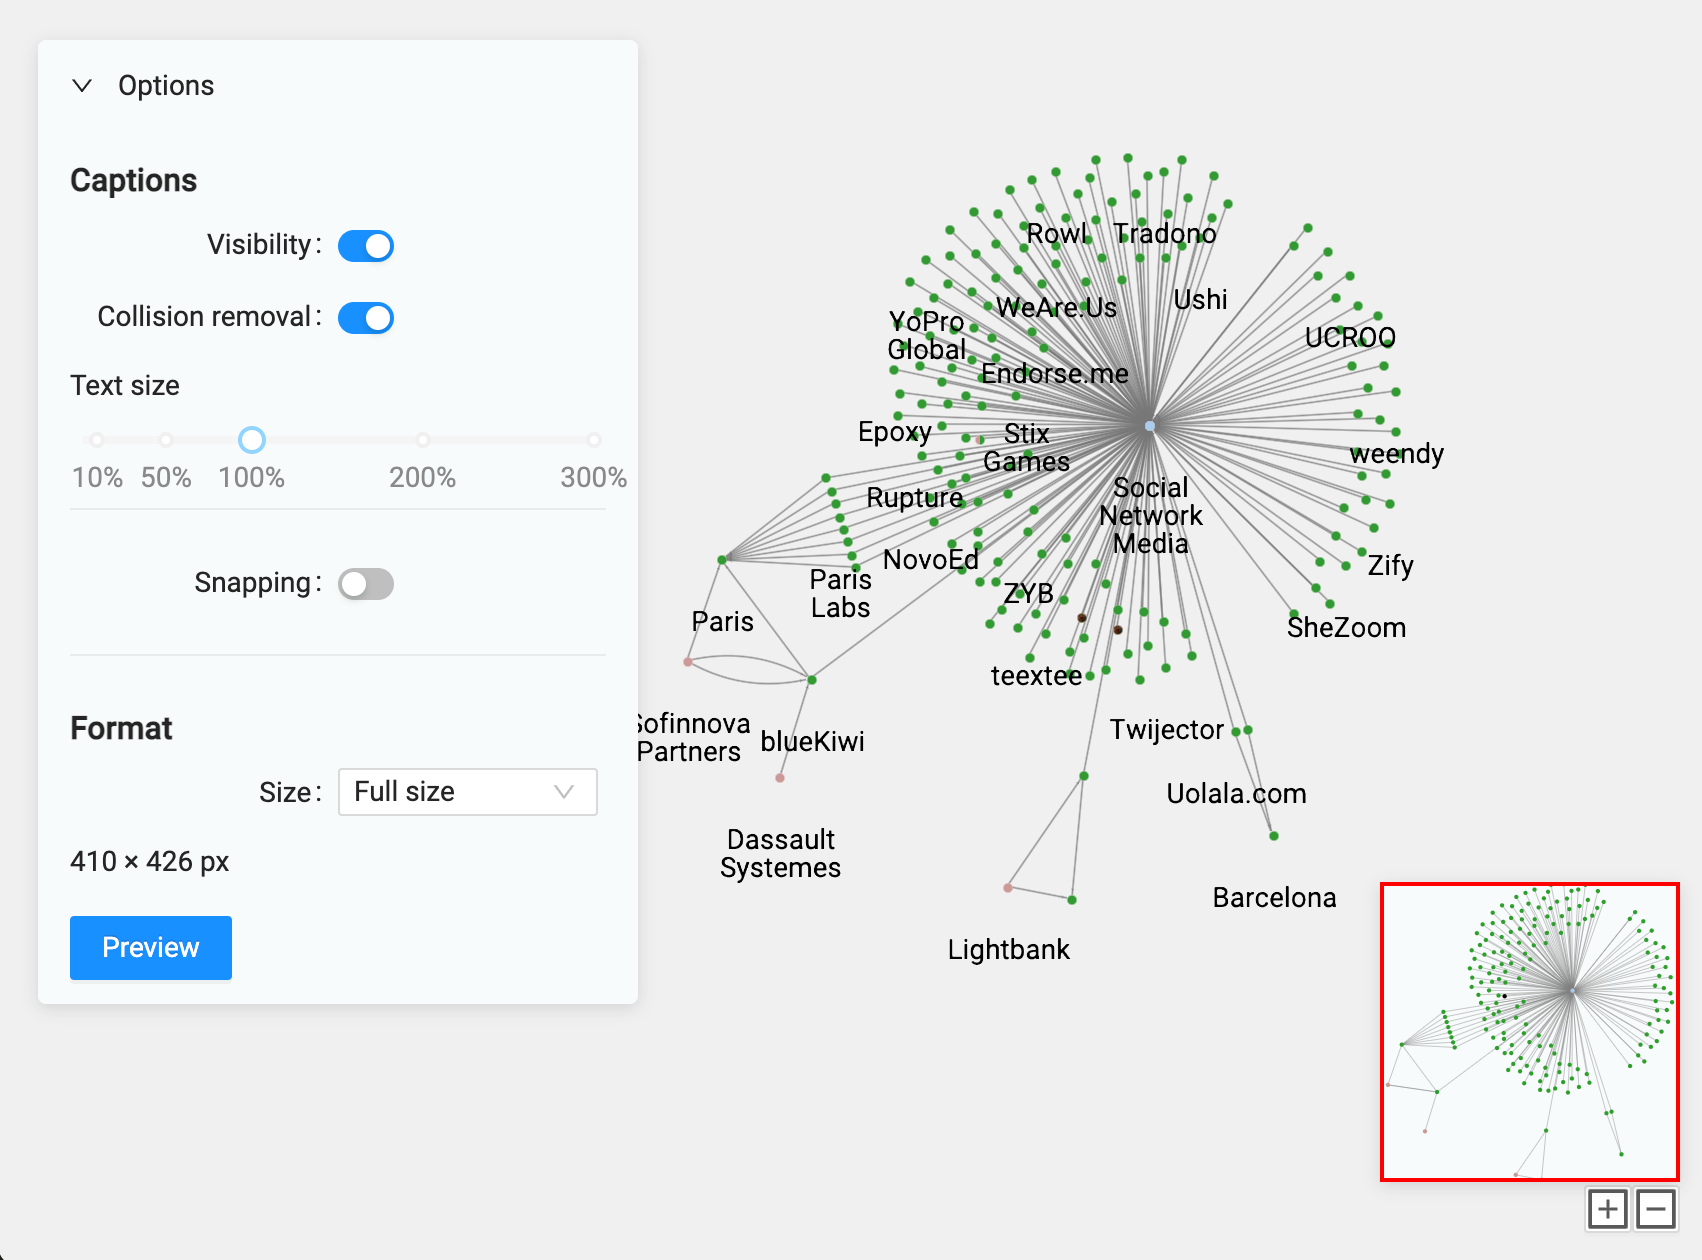
A graph visualization is a powerful communication tool. It enables you to understand complex patterns and relationships at a glance. Whether you are mapping out your IT ecosystem or tracking down sanctions evasions that need to be reported to the authorities, there are many reasons you might need to share a graph visualization with external collaborators.
In Linkurious Enterprise, you can export a visualization directly from the app using the image export feature to easily share it with whoever needs to see it.
You can also go a step further with the Image Export Plugin. This allows you to optimize the exported image of your graph visualization by improving the image quality, adding annotations, and more.
You may also need to share data from your visualizations with external collaborators. A prime example of this is in certain financial crime investigations. You may need to share a list of suspicious transactions or accounts with law enforcement or regulatory authorities.
You can easily export data with the in-app export feature. If you require more control over the specific data you’re exporting, however, the Data Table Plugin lets you do this. You can export a CSV file of, say, suspicious persons, customizing exactly which columns you want to export.
If you need an interactive visualization to be more widely available, we have a solution for that. You can export published visualizations to a URL or embed them in a web page. These exports contain a snapshot of the graph data and visualization at the moment of publication. Anyone can explore these visualizations interactively, making it possible for anyone to benefit from the insights uncovered within your graph visualizations.
Collaboration features in Linkurious Enterprise simplify teamwork so you can focus more time and energy on the high-value tasks that matter most. These features also enable you to smoothly share key information with external collaborators as needed, while keeping your Linkurious Enterprise instance secure.
To learn more about implementing these features in Linkurious Enterprise, or to learn how you can get started on graph visualization and analytics, contact us.
A spotlight on graph technology directly in your inbox.