Financial crime investigations with graph technology: Best practices from a data scientist
“The world’s multi-trillion-dollar financial crime epidemic is more than a money problem,” said Adena Friedman, Nasdaq Chair and CEO. “It has profound human costs from despicable crimes that have a deep and lasting impact on… communities.” From money laundering and fraud to sanctions evasion to illegal activities like human trafficking and arms dealing, financial crime is both prevalent and deeply damaging for individual victims and society at large.
Plenty of crime fighters are pushing back, from government agencies and NGOs seeking to expose and dismantle criminal networks, to financial institutions protecting their customers and complying with regulatory mandates.
But getting to the bottom of the often sophisticated, transnational networks of criminals and fraudsters poses big challenges, and legacy analysis and investigation tools often don’t go deep enough or permit investigators to work efficiently. As John Lambert, a corporate VP at Microsoft has said, “Defenders think in lists. Attackers think in graphs. As long as this is true, attackers win.”
Graph technology, in which relationships are as important as individual data points, has effectively emerged as a powerful tool for tracking down networks linked to money laundering, sanctions evasion, corruption, and other forms of wrongdoing. To get expert insights on best practices for investigating financial crime using graph technology, we turned to Wael Alawlani, a data scientist with experience working in financial institutions, and who has been pushing the boundaries of the capabilities of graph in his own investigations into international networks.
Individuals or groups involved in the illicit economy don’t want to be found - and they take great pains to conceal or dissimulate wrongdoing, making it very difficult to uncover suspicious or criminal behavior.
To get to the bottom of a financial crime investigation - to understand the full extent of a criminal scheme - investigators typically have to wade through vast quantities of data, often from multiple sources. And, gaining an in-depth understanding of how all the elements within a network connect with each other. Investigation techniques that rely on relational databases aren’t always well suited to gaining deep insight into sophisticated networks. While such investigative techniques may be suitable for certain use cases, they can be slow to deliver results and leave investigators with blindspots, failing to uncover the full extent of a criminal network.
Because of the way data is structured in a graph - as individual data points and the relationships between them - it delivers deep context for investigations. Analysts can use graph tools to discover the direct and indirect connections around entities of interest to understand risky or suspicious behavior and networks of influence. Graph also makes it easy to spot anomalies and patterns that might tip investigators off to illicit money flows or criminal schemes.
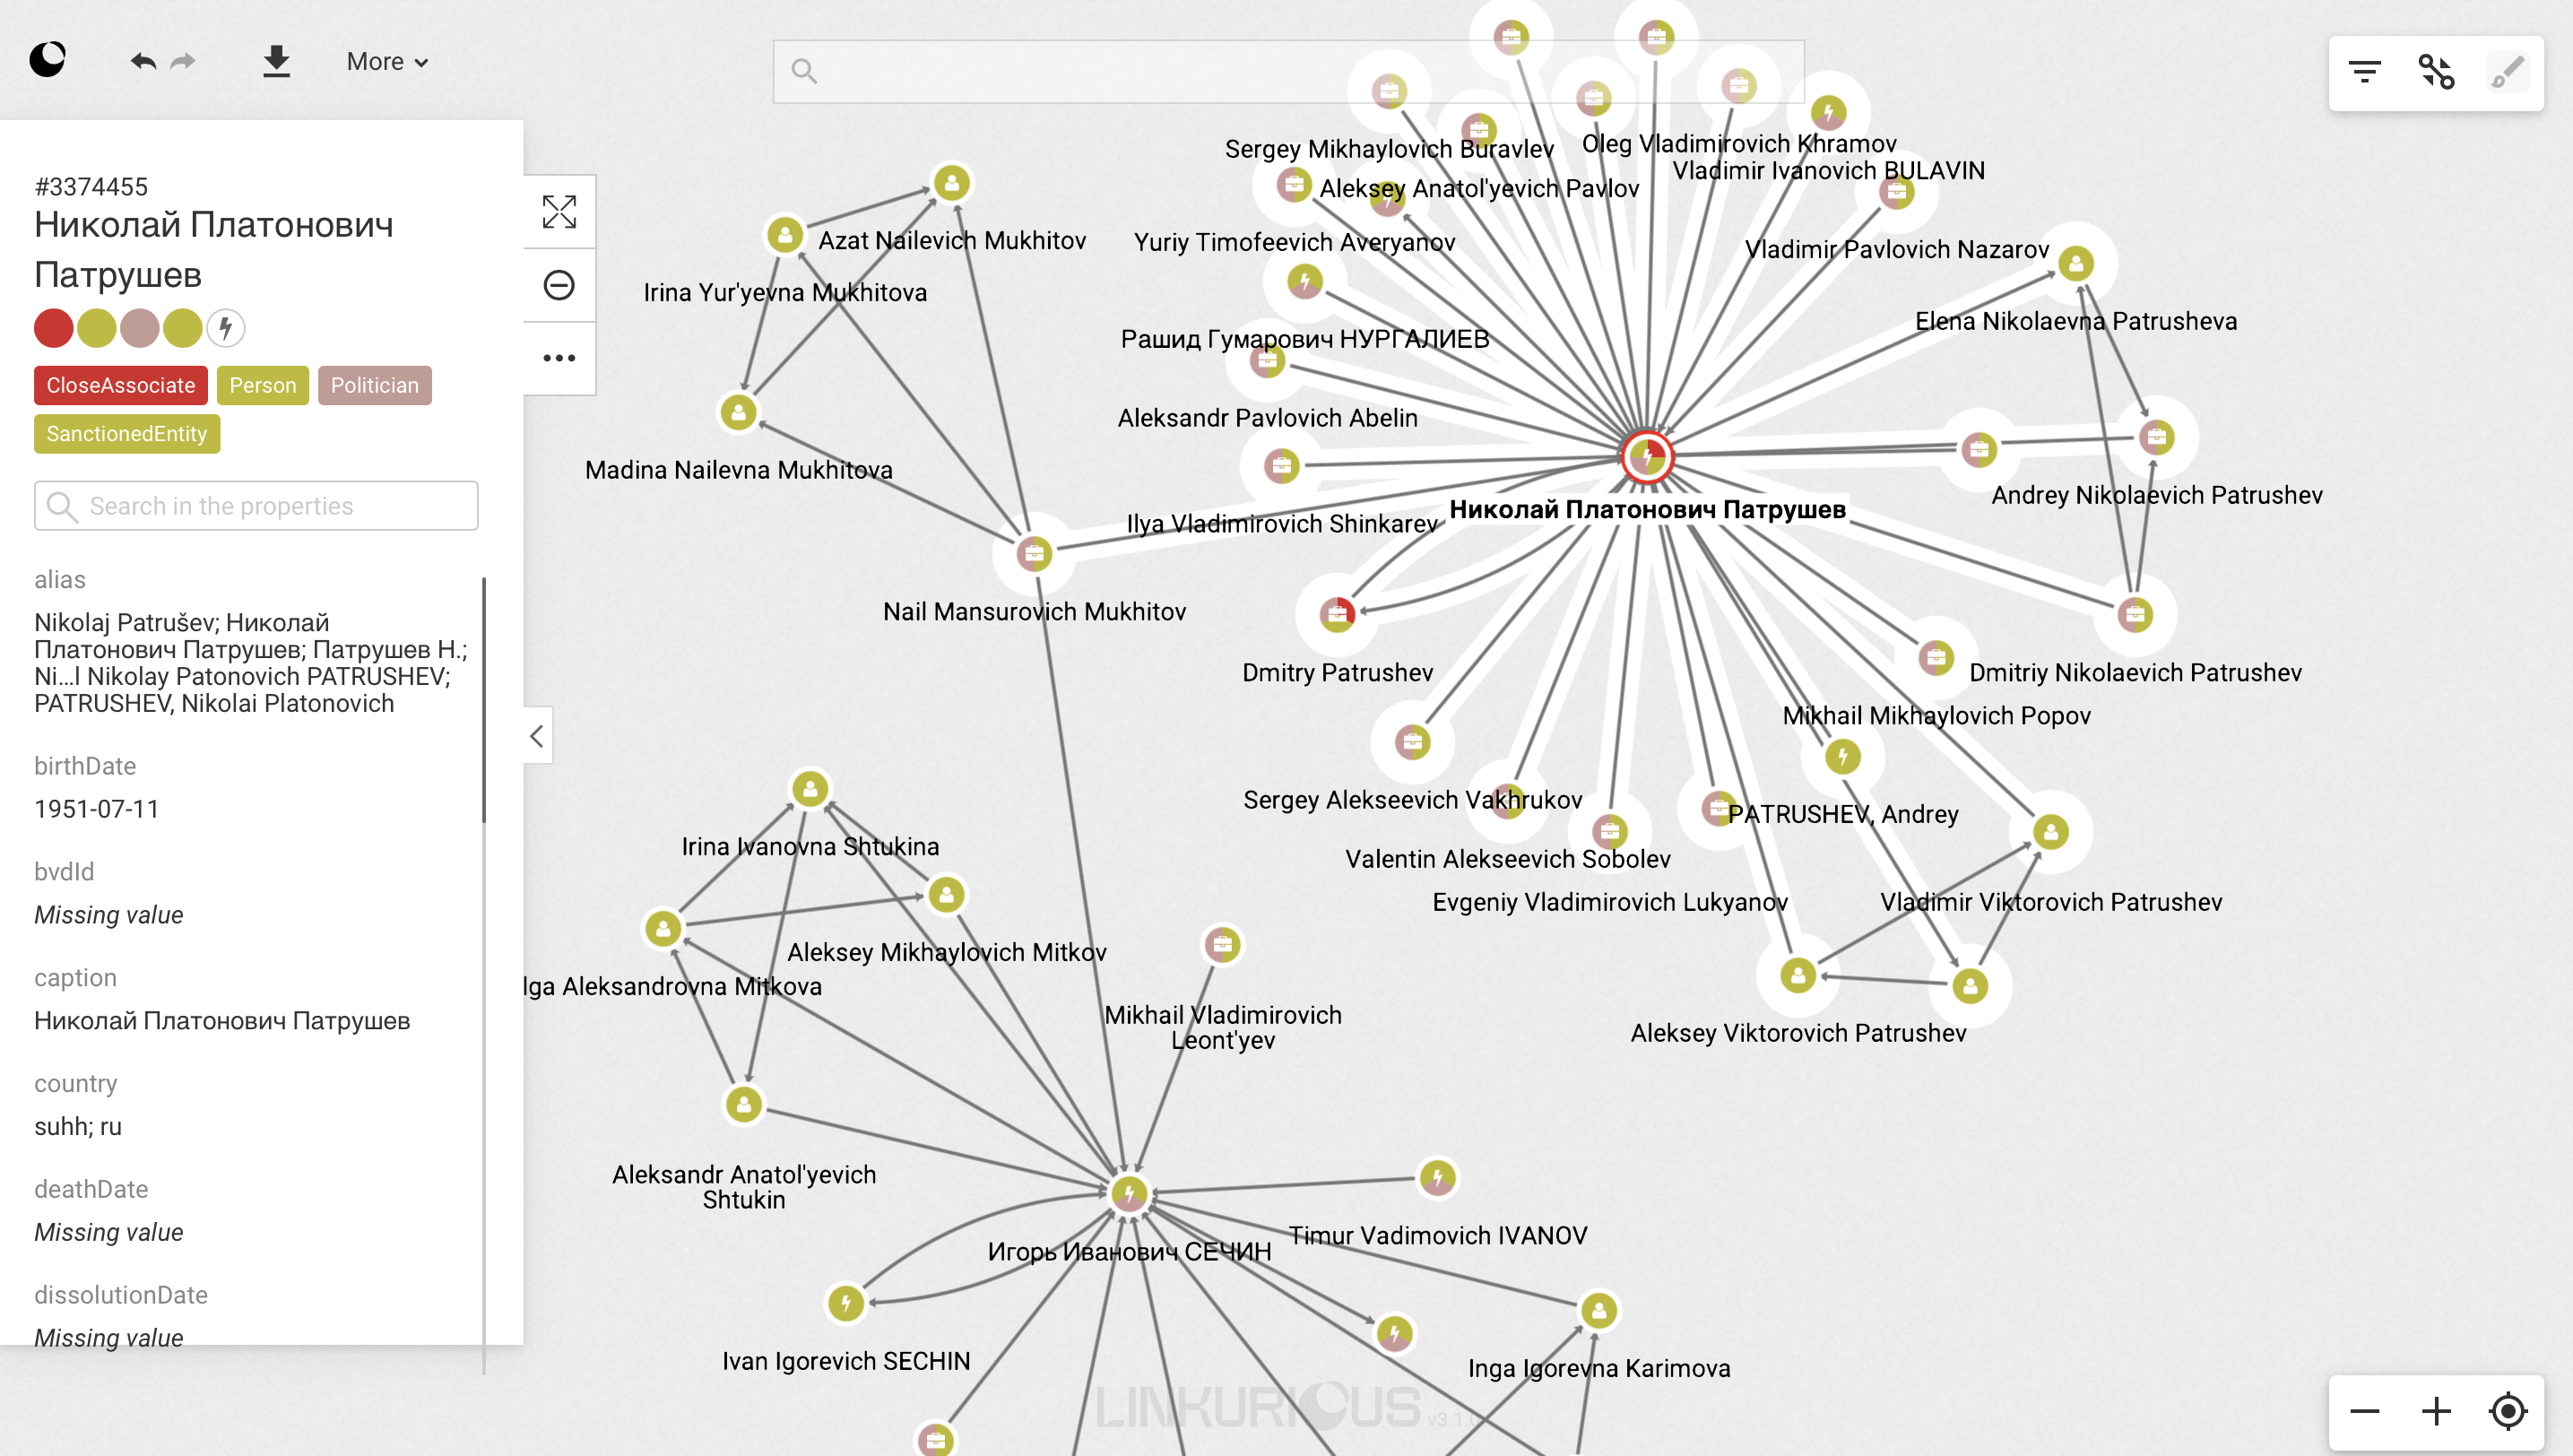
“Whether you’re looking at sanctions evasion or networks of ownership, it’s all about the networks,” says Wael Alalwani. “A sanctioned person has a whole network of people, government agencies, and companies he is associated with. And finding out who a sanctioned individual is associated with through shared entities is a graph problem.”

There are many practical applications for graph technology in financial crime investigations. These include:
- Transaction monitoring
- KYC/CDD screenings
- Fraud investigations
- Insider trading
- Terrorist financing
- Trade based money laundering
- Tax evasion
- Corruption and bribery
- Cybersecurity investigations
“The core of graph is the traversal - it has to do with relationships,” says Wael Alalwani. This lets investigators focus not just on an individual, but their whereabouts within a network.
He describes a couple of scenarios to illustrate how graph technology is particularly useful as an investigative tool.
A first example: looking for cases of sanctions evasion. “Sanctioned individuals can use relatives to incorporate companies, and together they form a network. In order to detect this behavior, which goes beyond the sanctioned individuals to reach their neighbors, we can quantify their network using node level metrics and network level metrics. For node level, changes in PageRank centrality of the sanctioned individual can be used. You can also see how a network has changed over time by looking at the clustering coefficient changes after sanctions were imposed on the designated individual/entity.”

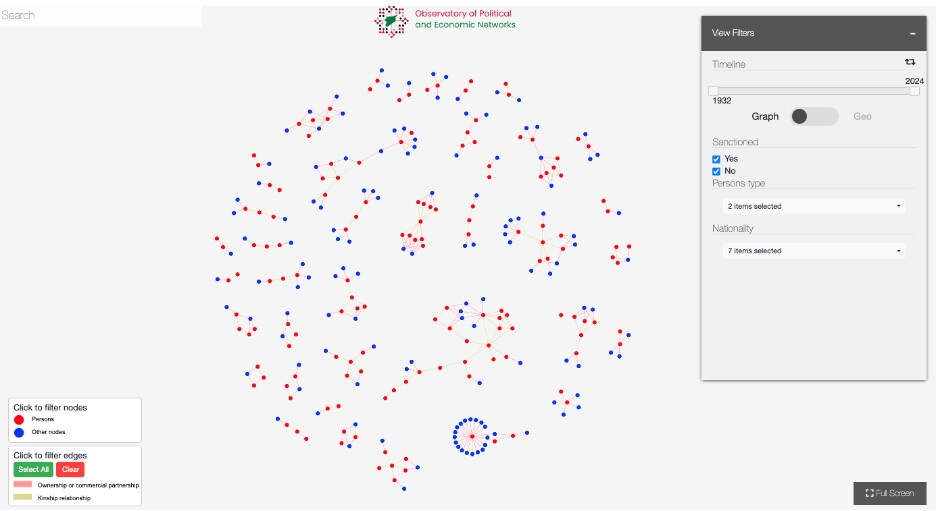
Graphs are also useful for getting to the bottom of sophisticated company ownership structures to understand if an ultimate beneficial owner is sanctioned or involved in other risky or illicit activity. “Looking into UBOs in a sanctions evasion investigation always involves entities working with other entities,” says Wael Alalwani. “In Syria, for example, companies incorporated in places like the Netherlands and Dubai had been used to smuggle goods and Iranian oil to Syria.” Investigations leveraging graph were able to identify those companies which were subsequently fined by OFAC.
Under the hood of a graph investigation is graph analytics. Graph analytics provides algorithms that help data scientists and data-driven investigators answer questions or make predictions using graph data. Several types of graph algorithms can help you get to the bottom of a network of suspected fraudsters, suspicious patterns of activity, sanctions evasion, and more. Wael Alalwani explains how centrality analytics, community detection analytics, and path finding analytics can help investigators.
Centrality analytics help you identify influencers based on their position in a network. Wael notes that different types of centrality analytics can help paint a more nuanced picture of the network you are investigating:
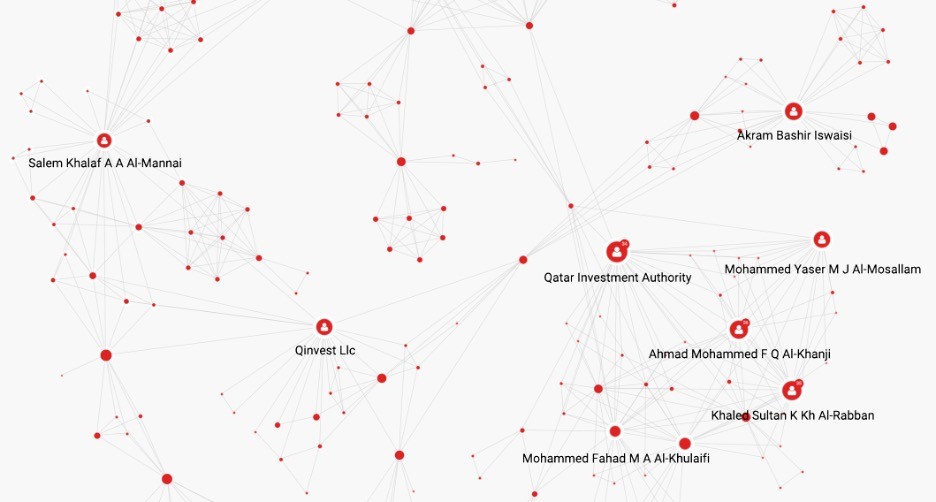
- Degree centrality focuses on the quantity of relationships, which can help identify the ringleader in a fraud network.
- Betweenness centrality helps identify individuals and entities linking different subnetworks. These entities could be gatekeepers in a criminal network, for instance.
- Closeness centrality will surface the individuals and entities in an ecosystem who are closer to everyone else, acting as brokers and fixers
- PageRank algorithm helps determine the quality of a relationship
These algorithms help determine an entity’s position AND influence within a network. Whether you’re looking at networks of fraudsters or an insider trading ring, centrality analytics can help you get the full picture.

Community analytics “help you detect existing communities and well-connected subnetworks. Communities can be formed for different reasons: they can be functional, such as someone performing a specific job, or organizational - someone belonging to a specific group like a company or organized crime group.
“There are well known graph algorithms to detect communities, like Louvain and Leiden algorithms.” These algorithms can help you determine, for example, whether a group is exhibiting a few suspicious behaviors or whether that group is actually a fraud ring, which would be indicated by a higher than average relationship density.
Path analytics let you explore direct and indirect paths connecting entities. “This helps understand the social capital of individuals and entities to generate recommendations,” says Wael Alalwani. “In the banking sector, for example, this helps understand the risk associated with certain individuals because they are a few hops away from a known perpetrator (i.e. risk propagation).” Also, this helps understanding what alternative paths someone might use when he/she is sanctioned.
As you approach and move through your investigation using graph analytics, be it understanding the network of a sanctioned entity or a politically exposed person, what are some of the best practices to keep in mind? With his years of experience in graph investigations, Wael Alalwani shared some of the most important points to keep in mind.
Not every financial crime investigation requires using graph technology. For simpler, descriptive, more straightforward investigations, you may be better off with a different approach. “If traversing relationships is at the core of the problems you’re trying to solve, graph will be a good tool for your use case.”
Think about the outcome before you get started. Who is the audience for your investigation? And who will you be communicating the results to? Will the results remain internal to your organization, will they be included in a suspicious activity report? These questions can help shape the direction of your investigation and even how you model the data in the graph.
Having an initial hypothesis can also be helpful. “I usually come up with a hypothesis before I begin an investigation,” says Wael Alalwani. “Sometimes the data will prove my hypothesis wrong, but having an initial vision for the investigation guides the process.” He suggests that having a hypothesis is useful even if you’re only in exploration mode and aren’t entirely sure what you want to find. Having a hypothesis can help give direction to your explorations.
The previous step - having a hypothesis and a vision for your investigation - will also help you set boundaries. “Try to define network boundaries and avoid excess data. You can have a snowball effect where your network gets bigger and bigger the more you explore,” says Wael Alalwani. “You can end up down a rabbit hole and lose the big picture if you don’t set up some boundaries around your investigation from the beginning.” Defining investigation boundaries also has implications for your data, helping define how granular your data model should be, for example. He also notes that you can use labels to delineate the data and draw boundaries.
Wael Alalwani suggests having a standard process in place to structure your investigation. In his case, this tends to be: define, collect, analyze, and visualize. “If you are working collaboratively, you can have separate duties for different steps in the process, which can help keep things clear, but team members always need to regroup and align their efforts,” he says.
You should also consider the level or type of analysis you want to apply in your investigation. “Doing this will determine the graph algorithms you need: centrality, path analysis, community detection, etc. These algorithms all address different questions.”
On the analysis portion of an investigation, Wael Alalwani recommends working collaboratively. When working with complex information - and complex networks - it can be important to see things from other perspectives to avoid drawing inaccurate conclusions. “Within the organization I work with, we always get peer reviews before publishing our findings.”
The power of graph technology lies not just in its ability to process vast amounts of data, but in how it fundamentally changes our approach to complex financial crime investigations. By thinking in graphs rather than lists, investigators can uncover the complex networks that criminals work so hard to obscure. Whether exposing sanctions evasion schemes or mapping beneficial ownership structures, graph technology enables investigators to see the full picture of financial crime networks and identify key players who might otherwise remain hidden. “Graph is actually built for this,” says Wael Alalwani.
A spotlight on graph technology directly in your inbox.

