Transaction monitoring: Navigating connected data for effective context based monitoring
In the United States alone, there were 54.8 billion credit card transactions in 2022 (1). Globally, non-cash transactions are growing at a rate of 15% a year and are set to reach 2.3 trillion by 2027 (2). Within those billions and trillions of transactions are hidden anomalies and patterns that can signal suspicious or criminal behavior.
Within the financial industry, transaction monitoring acts as a key mechanism for detecting unusual transaction patterns that may send up a red flag for fraud, money laundering, or other financial crimes. Transaction monitoring establishes a baseline of normal transactional behavior - and detects patterns that don’t conform to the norm.
Traditional methods of transaction monitoring often struggle to accurately distinguish between real threats and harmless anomalies, leading to false positives, false negatives, and operational inefficiencies. In the context of these challenges, graph technology stands out as a transformative solution. By analyzing the connections within the data, graph analytics brings context to transaction monitoring, improving detection of sophisticated patterns that may otherwise remain hidden.
In this article we’ll explore the challenges inherent in transaction monitoring, and will look at how graph analytics and visualization offers more efficiency in identifying and investigating financial crime risk.
Transaction monitoring is the process of monitoring customers’ transactions, including transfers, deposits, payments, and withdrawals. A transaction monitoring system (TMS) seeks to identify unusual or suspicious behavior that could indicate potential money laundering schemes or other financial crimes.
Transactions the monitoring system flags as suspicious need to be investigated to determine whether the alert is a true hit or a false positive. For true positives detected by the TMS, financial institutions need to file suspicious transaction reports (STRs) or suspicious activity reports (SARs).
Ongoing transaction monitoring is a regulatory requirement for businesses in the financial services sector and other regulated industries to mitigate money laundering and terrorist financing risk. These include:
Transaction monitoring is an essential part of anti-money laundering compliance programs. Financial institutions are under the legal obligation to scrutinize clients and their transactions for signs of money laundering.
Failing to do enough to catch or prevent money laundering activities can bring serious consequences, often in the form of heavy financial penalties.
We’ve seen that in the case of Danske Bank, which has been under investigation in several countries including the United States over $220 billion in payments through its branch in Estonia between 2007 and 2015. This money laundering scandal and the related investigations resulted in Estonia banning Danske Bank, and kicked off aggressive investigation by regulators in both Europe and the United States. In December 2022, Danske Bank pled guilty to the charges and agreed to a $2 billion fine with the United States Department of Justice.
Traditional transaction monitoring approaches come with certain drawbacks that can leave the organizations that depend on them vulnerable to high risk activity.
Many transaction monitoring systems depend on simple rules to pinpoint anomalies: How many transactions have occurred over the last week? Is this behavior in line with the client’s past behavior? These kinds of simple rules will turn up known anomalies, but they don’t take advantage of context and inevitably miss part of the picture.
Smart criminals are often aware of the kind of controls financial institutions have in place to catch them in the act. They have long adapted to those controls and know how to quietly bypass them - or to evade detection long enough to succeed.
Because they fail to take context into account, those static rules also turn up a lot of results that are in fact benign. AML teams then spend too much of their limited time and resources chasing false positives instead of investigating actual criminal activity and adapting to new threats.
Adding contextual information to your transaction monitoring systems goes a long way in helping you spot risks. And graph technology is well suited to deliver context to your detection and investigations.
It’s difficult for analysts to make an informed decision about alerts using only internal data. Graphs allow you to store, query, visualize, and explore a wide range of relationships between data points across different data sources. This can include both internal sources such as KYC data, along with third-party data sources.
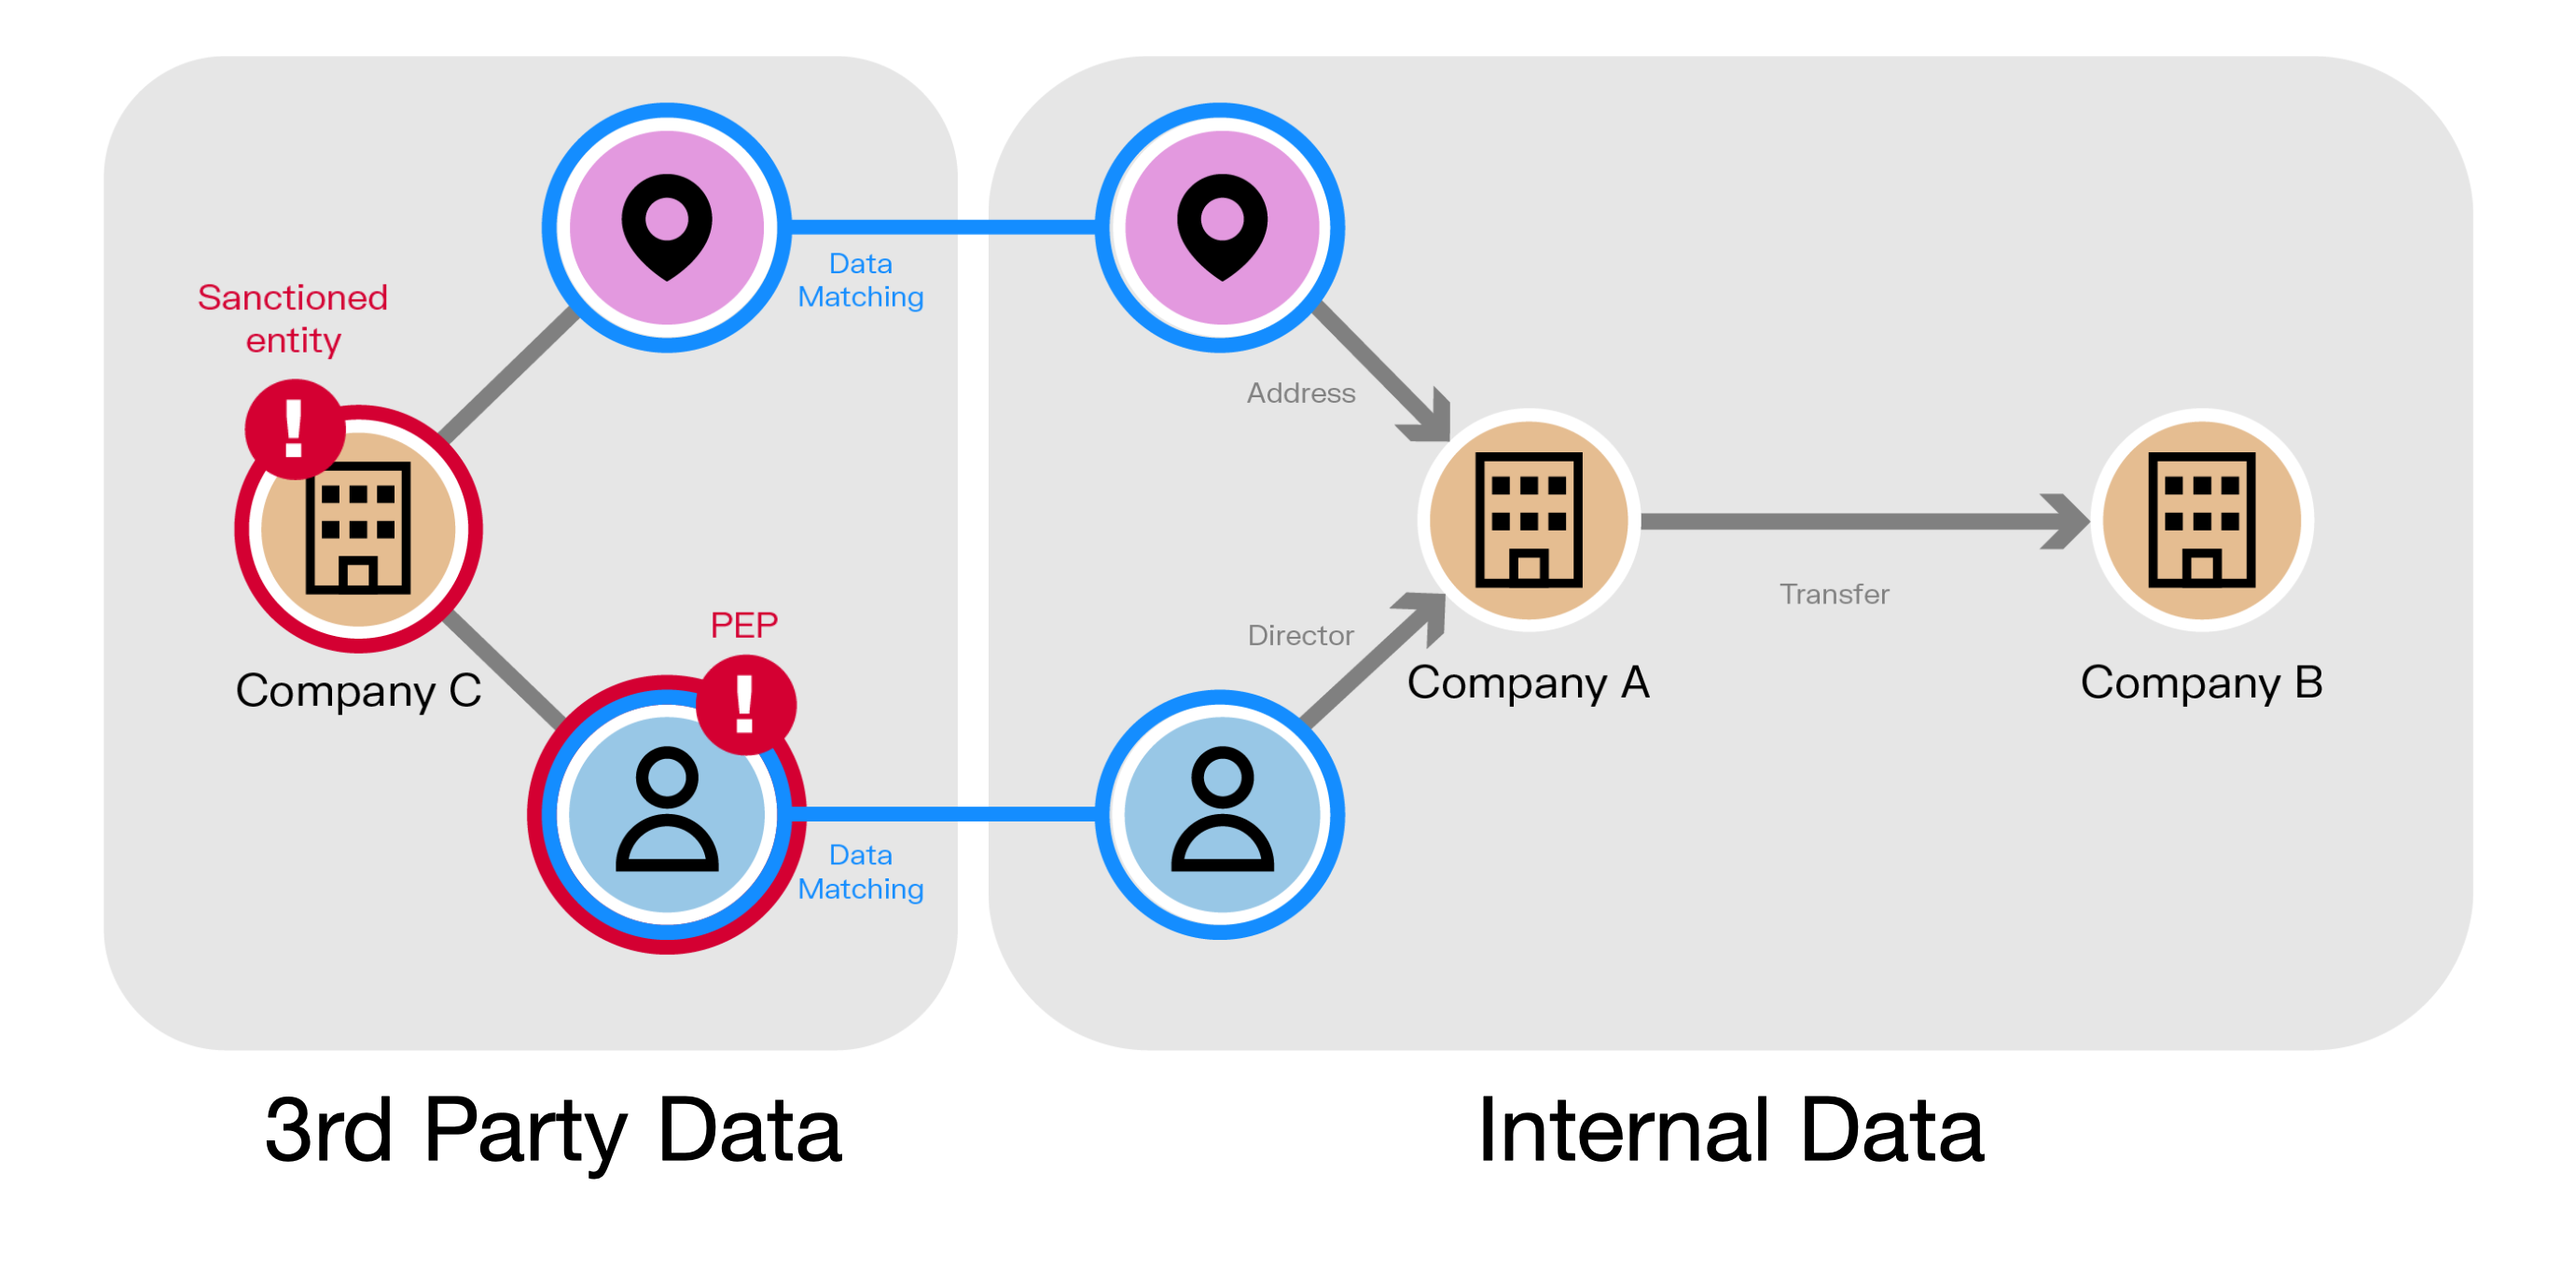
Graph de-silos this data, providing an extended contextual environment and a 360 view of clients and their direct and indirect connections to enhance transaction monitoring.
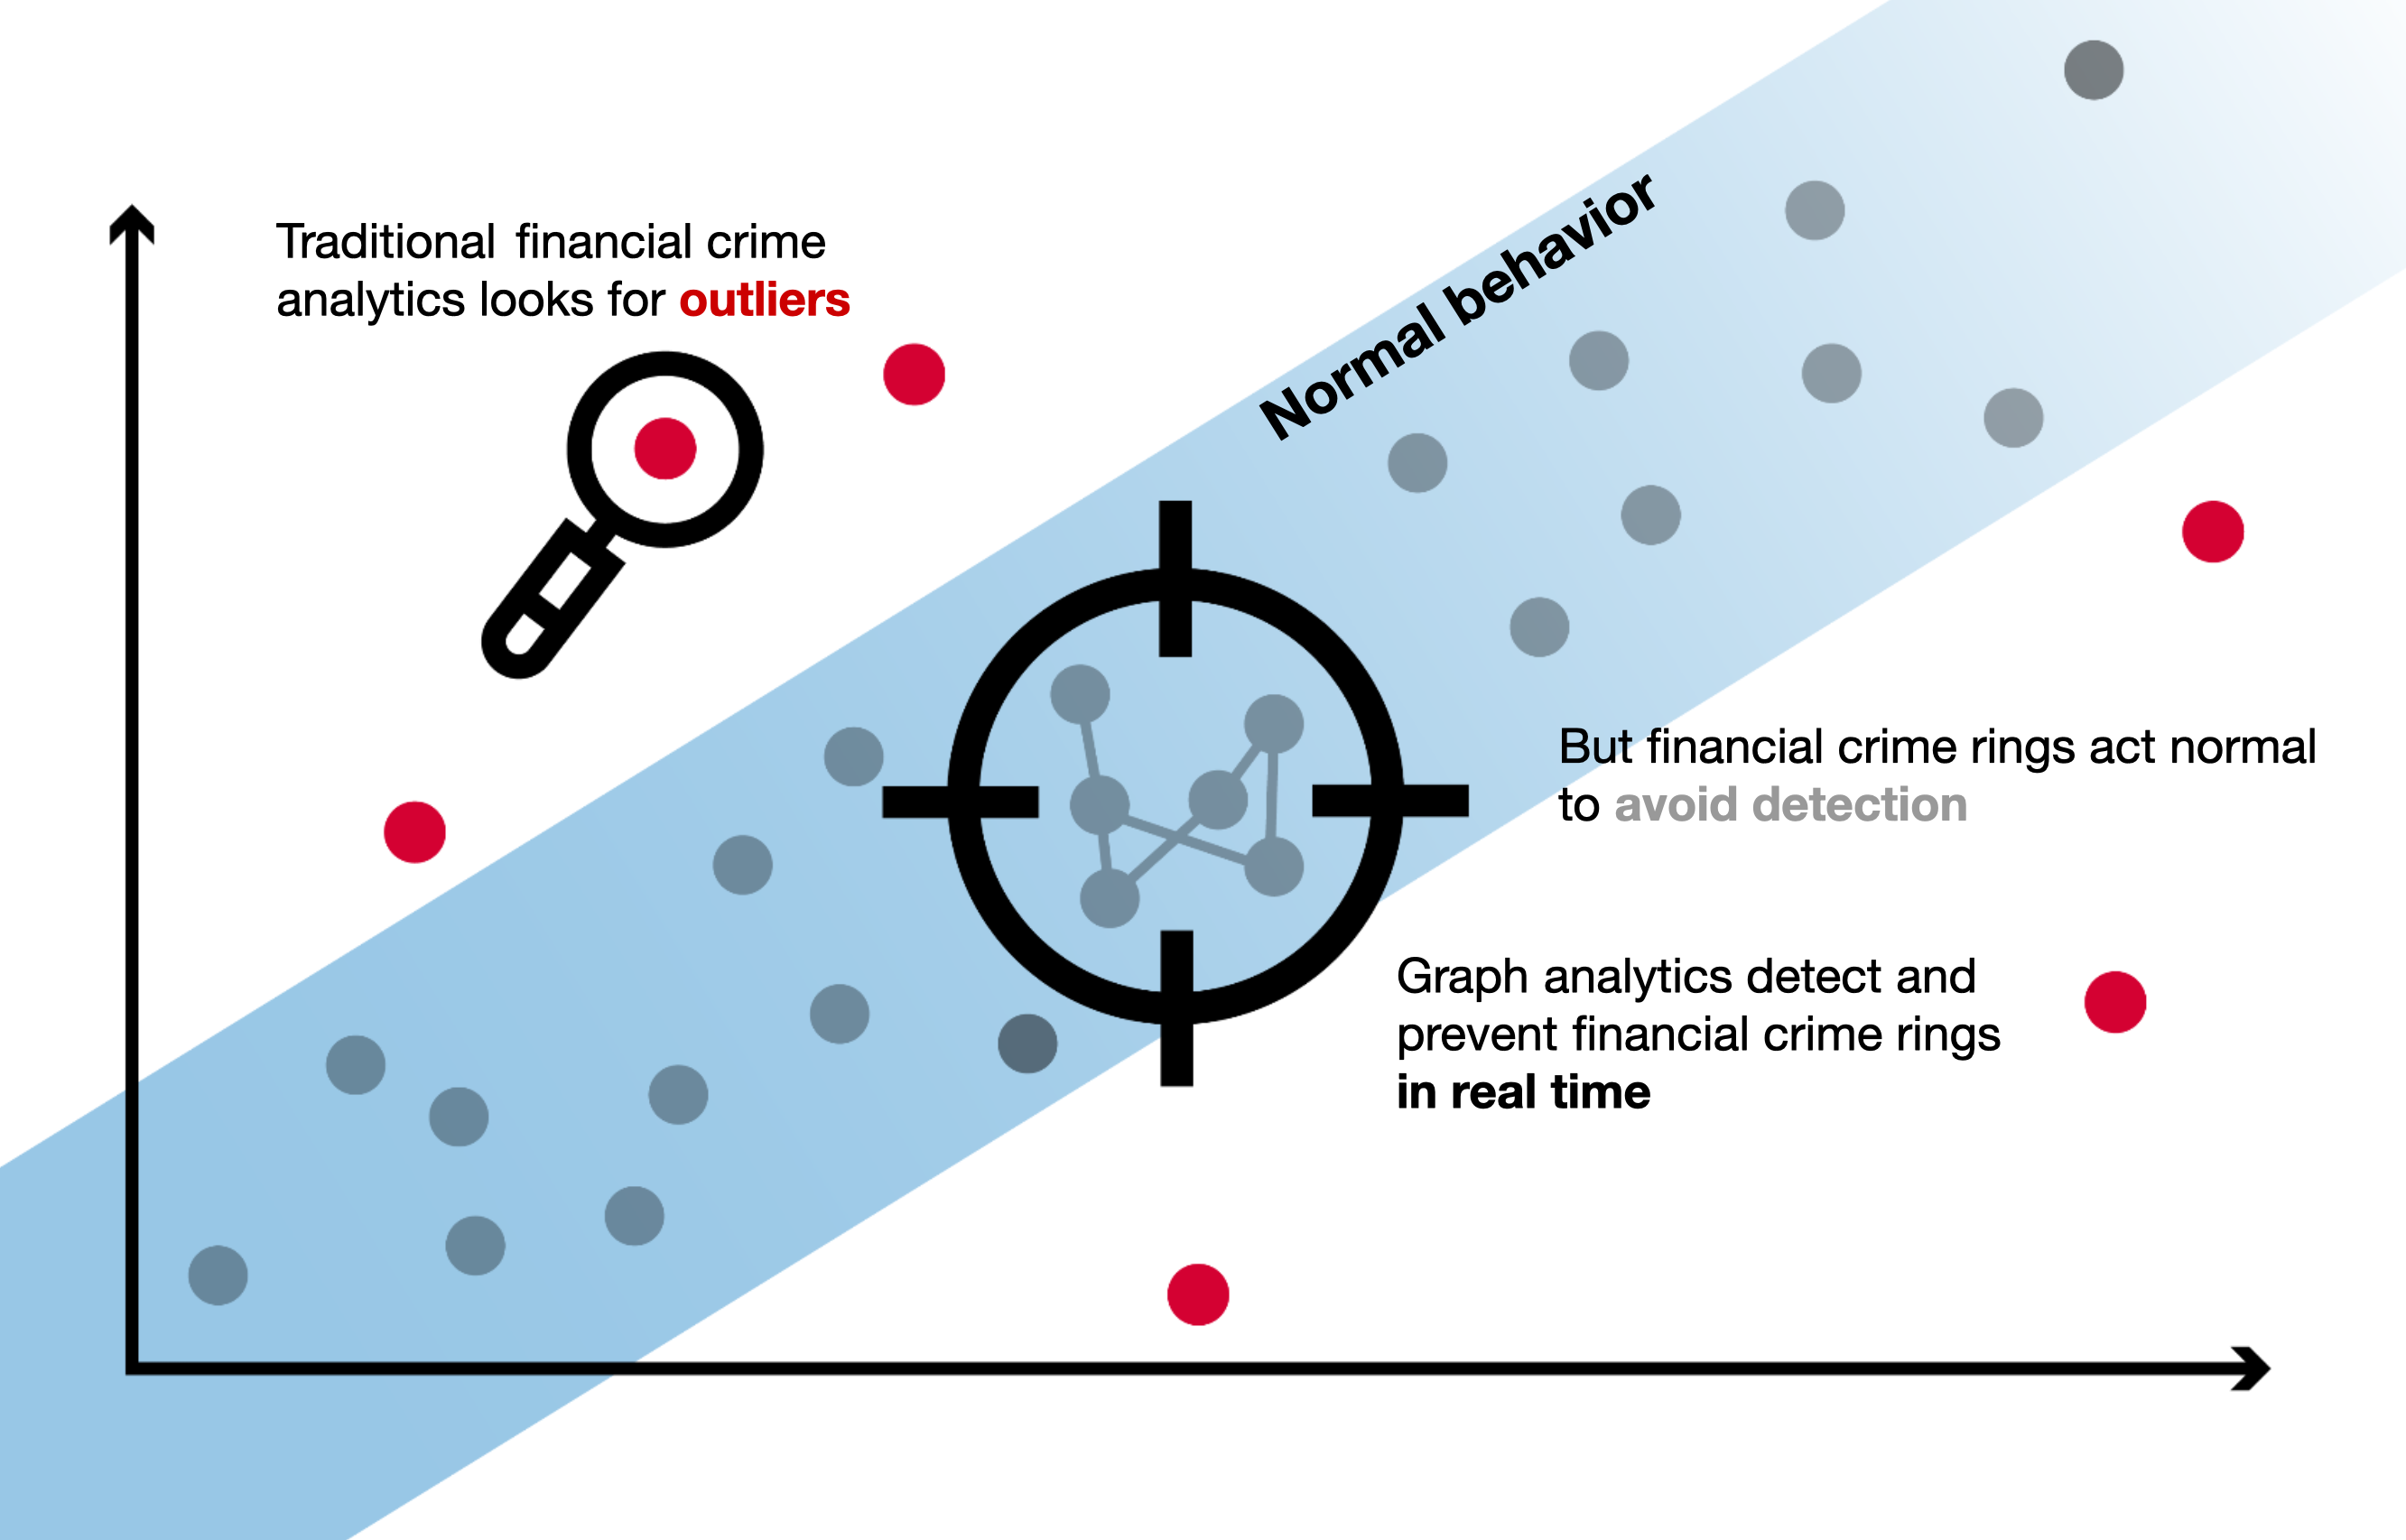
In analyzing the full context, graphs are able to detect risks that would otherwise go unnoticed. By focusing on anomaly detection alone, most transaction monitoring systems only detect the single elements - the outliers - that deviate from normal transactional behavior. Of course, anomaly detection turns up a lot of criminal behavior. But it tends to catch individual fraudsters and money launderers while turning a blind eye on more sophisticated criminal networks.
Graphs, on the other hand, enable you to dig deeper into evolving financial crime patterns by detecting in real time suspicious relationships even within “normal” patterns of transactional behavior.
Graphs offer several advantages when layered into transaction monitoring systems:
- More effective investigations. Network visualization makes it easy to quickly understand the context around any situation. It saves you time chasing down information.
- Fewer false negatives. Sophisticated criminals are experts at bypassing static rules. By analyzing entire networks, graph analytics are effective in uncovering complex criminal schemes as they emerge.
- Adding context to machine learning models. Graph solutions easily layer into other tools. You can leverage graph analytics and graph embeddings to provide extra input to your machine learning models.
Graph algorithms can efficiently help detect and analyze even the most complex money laundering schemes. Here are some examples of how they perform for transaction monitoring.
- Centrality: Identify the hubs within a network that centralizes funds and dispatches them.
- Path finding: Follow the money between bank accounts and businesses. Loops within the graph visualization might indicate money laundering.
- Community: Identify clusters of nodes within a database as an indicator of collusion in a money laundering scheme.
- Real-time querying: Identify in real time discrete connections between a sanctioned entity and transactions in your client database as possible clues of sanctions evasion.
Linkurious Enterprise investigation software leverages graph analytics to detect suspicious patterns across billions of entities and relationships and to facilitate investigations. It fits in easily with existing solutions and can be other software solutions depending on your needs: graph databases, entity resolution, third-party data providers, and more.
Linkurious Enterprise can also be used to enhance existing transaction monitoring systems, bringing powerful advantages to teams of analysts and investigators:
- Graph visualization capabilities for intuitive exploration of networks around suspicious transactions
- Graph analytics add context for more precise and comprehensive risk detection
- Enhanced data quality via entity resolution
In a recent webinar, we took a deep dive into Linkurious Enterprise for transaction monitoring. In the demo, we took a fictitious dataset containing data around people, companies, and transactions, augmented it via entity resolution, and combined it with data from OpenCorporates, a third-party datasource.
We then used graph analytics to assign risk scores to entities, detect suspicious activity, and conduct investigations on those suspicious transactions. See part of the Linkurious transaction monitoring demo in the video below:
To see the full demo and learn more about using graph analytics and visualization to enhance your transaction monitoring with context, watch the replay of our recent webinar.
(1) https://capitaloneshopping.com/research/number-of-credit-card-transactions/
(2) https://www.capgemini.com/news/press-releases/global-non-cash-transaction-volumes-set-to-reach-1-3-trillion-in-2023/
A spotlight on graph technology directly in your inbox.