Data lineage tracks the flow and evolution of information through a system or process. Understanding the origins of your data, where it’s going, and any processes it has undergone, it becomes more secure and usable. For large organizations, data lineage is also a key compliance requirement. But organizations dealing with large quantities of data or many different data sources struggle to connect data sources together because of regulatory constraints, complex technology and scattered data.
Graph technology is a powerful asset for managing data lineage. It provides a clear and intuitive way to understand the relationships between data elements in a complex system. It helps identify and address issues more quickly and make better decisions about how to manage data.
In this article, we’ll take a look at the fundamentals of data lineage: what it is and what some of the major use cases are. And we’ll also look at what graph analytics and visualization can bring to organizations managing complex, connected data.
Data lineage refers to the full journey of data within an organization: where it originates, how it moves, and how it changes along the way. As data flows from source files into databases, reports, and downstream systems, it usually passes through multiple transformation steps. Understanding that journey, and being able to trace any given data point back to its source, is the purpose of data lineage.
For large organizations, this is rarely simple. Data pipelines branch, merge, and evolve over time, making it genuinely difficult to know whether the numbers in a report reflect what you think they reflect. Poor data quality from a misconfigured transformation, an undocumented schema change, or a silent upstream error can quietly distort the insights that teams rely on to make decisions.
That foundation unlocks practical capabilities. With reliable data lineage in place, teams can, for example:
- Swiftly trace the root cause of a data quality issue
- Understand the downstream impact before making a schema change
- Demonstrate compliance with data privacy regulations by showing exactly where sensitive data flows
Data lineage also makes onboarding easier: new engineers and analysts can explore an unfamiliar pipeline with confidence, rather than having to reconstruct its logic from scratch.
Data lineage is important because it lets teams go beyond simply understanding the source of their data. Having the big picture of data movements and the changes it has undergone plays an important role in risk management, data quality, compliance, and more.
Here are some examples of areas where data lineage is particularly important:
Many domains—like healthcare, finance, or government—are subject to regulatory compliance related to data usage. These include GDPR, HIPAA, BCBS 239, and others, and require organizations to keep meticulous records of how private data is collected, processed, and used.
Data lineage helps organizations comply with regulations by tracking data movement, identifying its sources and destinations, and documenting transformations that take place during processing.
By tracing the movement of data, organizations can identify potential security and privacy risks, such as unauthorized access or data breaches. Data lineage can also help identify potential operational risks, such as errors or inconsistencies that could impact decision-making or compliance.
Data lineage also helps minimize the impact and minimize risk when incidents do occur. It allows organizations to quickly trace the root cause of data-related issues and understand their impact across systems. By providing a deep understanding of data dependencies, data lineage empowers teams to quickly respond to incidents, leading to faster remediation and minimizing the potential damage to business operations.
Data lineage is one of the best tools to ensure data quality. It’s possible to manually trace the lineage of a limited number of tables with a small number of data sources. But the reality is that most enterprises today use much greater quantities of data. Adopting enterprise data lineage allows organizations to scale their data quality.
Data lineage provides transparency into how data is collected, transformed, and used, enabling better-informed decision-making. By understanding the data flow and processing steps, decision-makers can make more accurate and timely decisions, and have greater confidence in the reliability and accuracy of the data they are using.
But you need the right tools to get this kind of value out of your data lineage.
Part of the issue is due to the limitations of the tools organizations are using to map and track data lineage. Most of them are backed by Relational Database Management Systems (RDBMS), in which the data architecture is tabular, with rows and columns. This is well suited for operations where data is consistent and not highly connected. But for connected data, these relational analysis tools have some drawbacks. For instance:
- Querying connected data through SQL is a hard and error-prone process;
- Long processing time and low performance for questions that require looking up multiple connections (like getting the full data lineage of a given property);
- It’s hard to accommodate an evolving data model in a relational database.
Graph databases are a perfect foundation to meet the challenges of data lineage. They feature a different way of storing data: as a graph of connected entities. In a graph data model, the relationships are as important as the individual data points. When data is deeply interconnected, graph databases help you ask better questions and get faster, more relevant answers.
There are several advantages to this approach:
- It’s easy to model the flow of data in a graph;
- You can query relationships with ease and in real time;
- A graph schema can evolve to accommodate new data and relationships.
In the next section, we detail how to use a graph visualization and analytics tool like Linkurious Enterprise to build a powerful and easy-to-use data lineage system on top of a graph database system.
To build an effective data lineage system, you need to map the various data elements and the processes or algorithms they go through. To be thorough, you’d have to track the files, the tables, views, columns and reports in databases, the ETL jobs, etc.
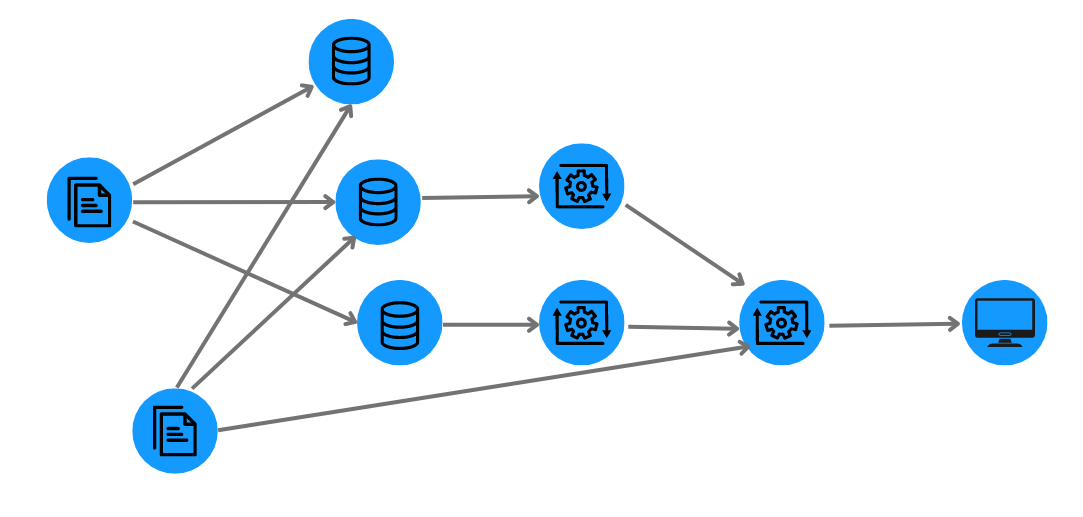
For the purpose of clarity, we have prepared a small dataset that focuses on four types of entities: the metadata, the systems, the processes, and the reports. We modeled our data as a graph, as depicted below.
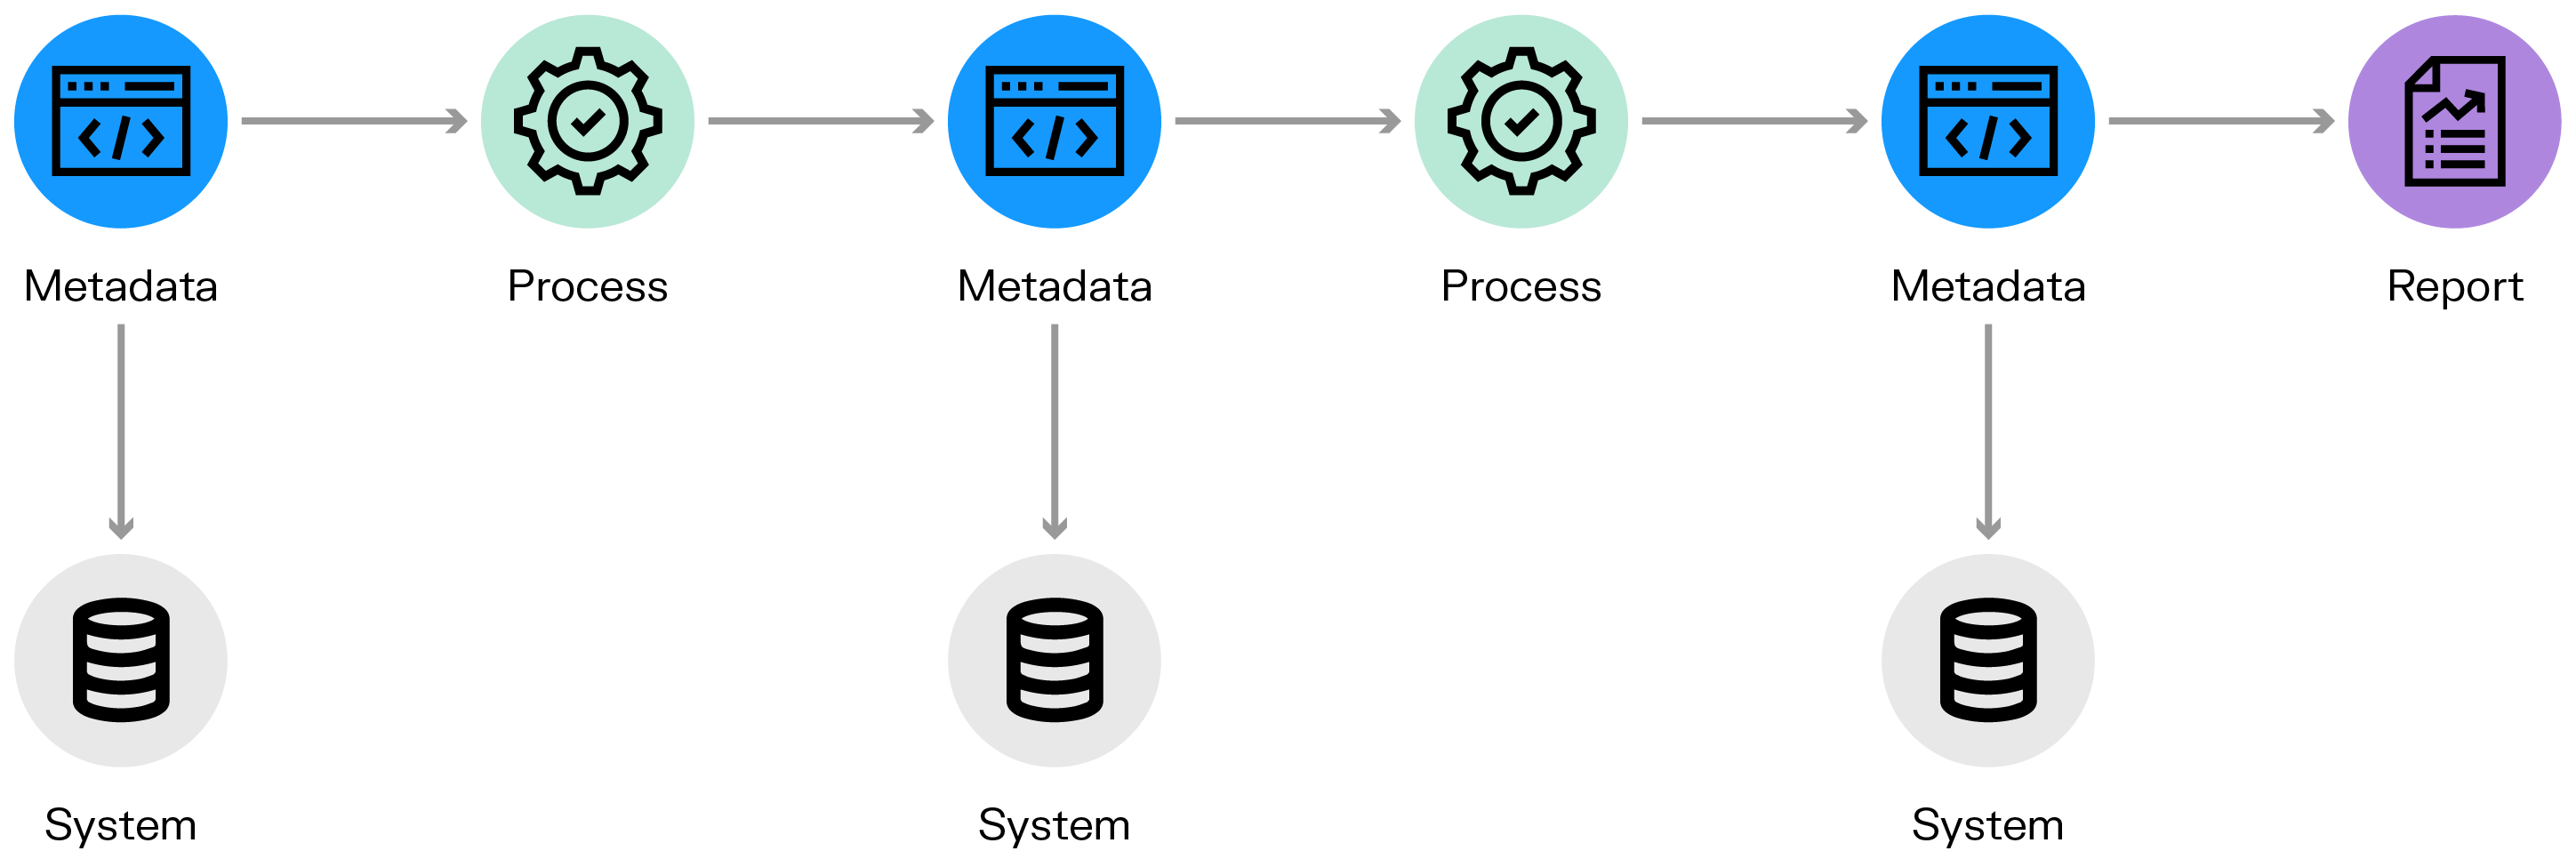
Metadata (blue nodes) summarizes basic information about data. It can be, for example, the column name is a database and its type. Metadata can flow through a process (green node) such as an ETL job, a SQL query or program code to another metadata. It is stored in a system (gray node) like a database. Finally, it can be used in a report (violet node) a set of data accessible to end users through a visual interface.
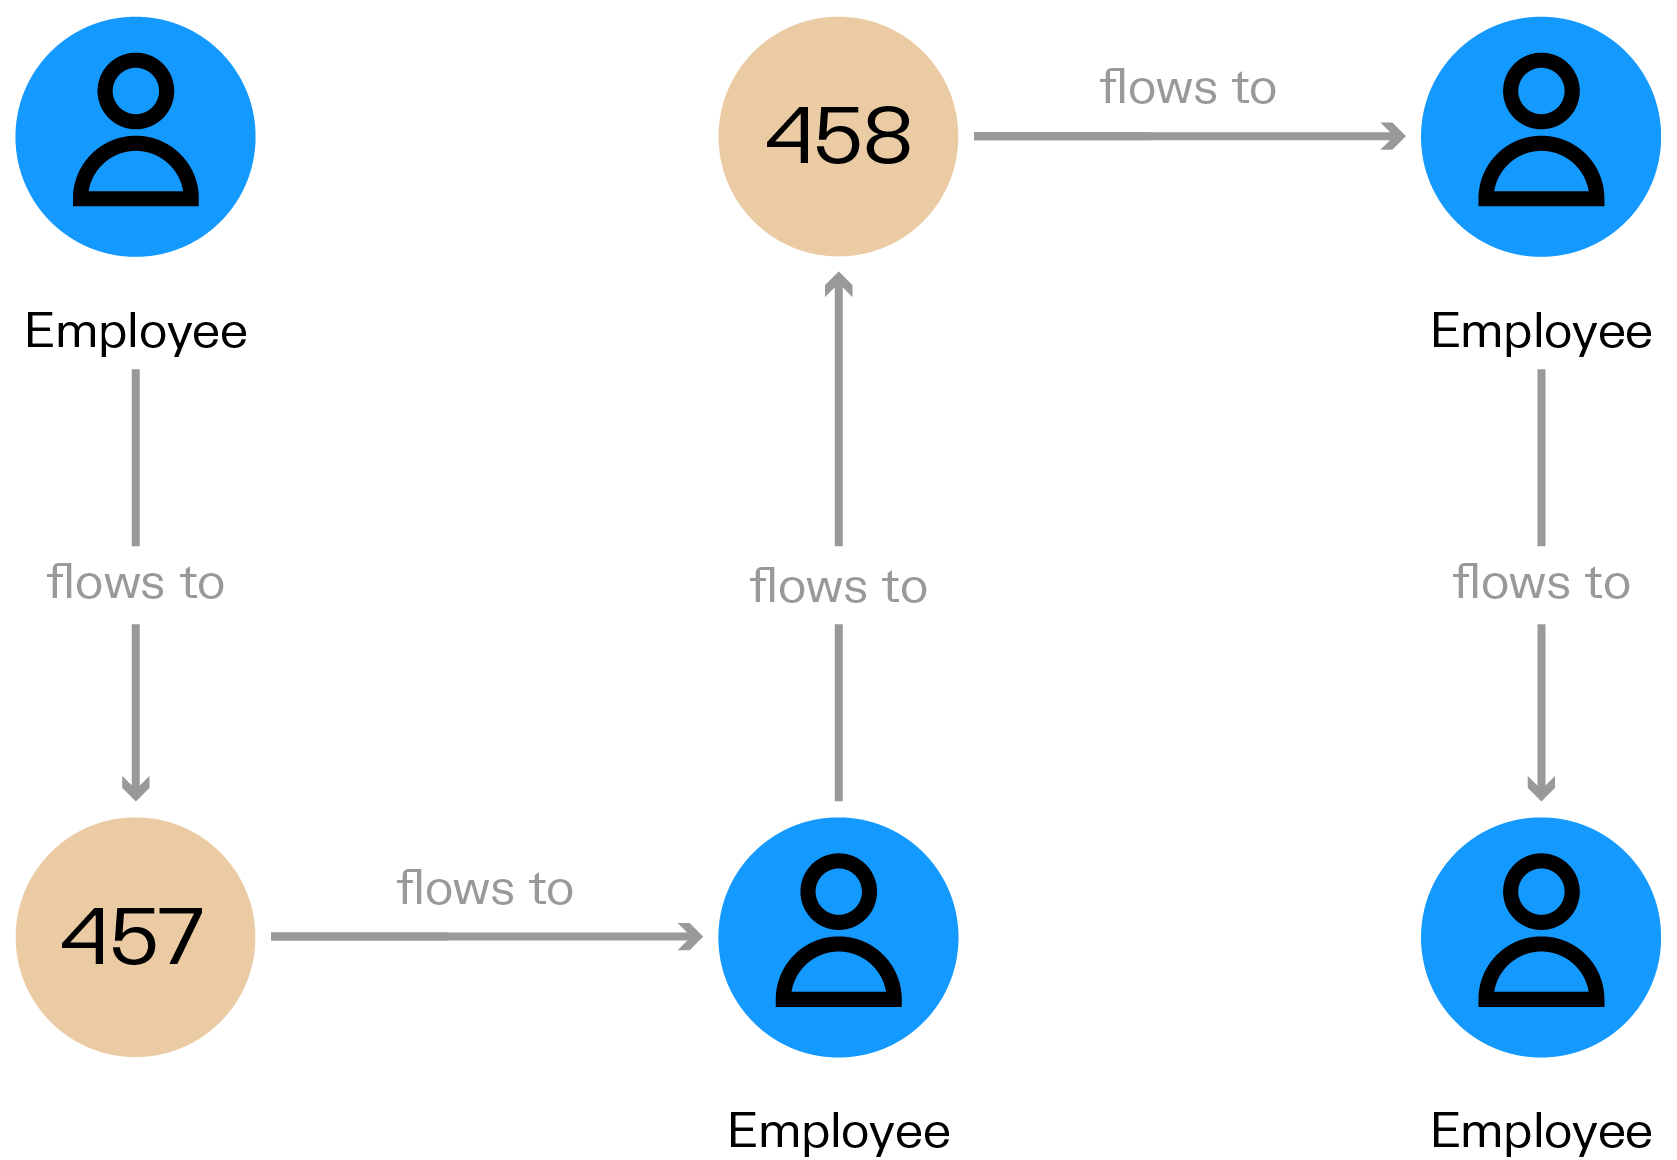
Having the data within a graph database (such as Neo4j, Memgraph, or others) allows you to ask questions about your graph visualization and analytics tool, like “what is the data lineage of report y”. For that kind of query, we can use Cypher, the Neo4j query language. The query below, for example, help to understand where the data from our sales report comes from:
// Data lineage pf the “Employee count” report
MATCH (a)-[:FLOWS_TO*]->(b:REPORT {name: ‘Employee_Count’})
RETURN a,b
That query will return all the entities which are involved in the report in question.
Here are a few other questions you can quickly answer using graph analytics:
- Is my database still being used in an important company process, or can I remove it?
- What systems and reports would be impacted by a change in a particular process?
- Which data is used by whom?
Visualizing your data lineage is a key element to understanding data flows and dependencies. A graph visualization and analytics solution sits on top of a graph database. It gives business users the ability to visualize and analyze data lineage to find answers without the need for programming skills.
Using a graph visualization and analytics solution such as Linkurious Enterprise, you get access to full text search features to look for any property or data element in the database through a search bar to quickly drill down into the information most relevant to you. Advanced querying features, including tools that leverage AI and an easy-to-use visual interface mean you can find insights and patterns of interest in a few clicks.
Within the interactive graph visualization interface, you can explore the graph by expanding the relationships of your choice to find answers. That’s the difference between having a theoretical capability of tracking data lineage and an analyst being able to quickly answer a question regarding the provenance of her data with confidence.
For example, if you want to understand what data is used for your sales report, you can simply look up the report via the search bar and add it as a node to your visualization. You can then explore its connections. In a few seconds you can find out that the origin of your report is the order_total metadata stored in the sales_db.
In our example, we worked with a sample dataset, but users can visualize graphs with billions of nodes and edges in Linkurious Enterprise. The tool offers advanced filtering options, letting you slice and dice the data to focus on relevant pieces of information and answer crucial data lineage questions.
Approaching data lineage from the graph perspective is a way of tackling the challenges faced by organizations. By bringing the data silos into an holistic view of connected entities, graph technology Linkurious Enterprise helps analysts take control of their data.
You can try Linkurious Enterprise now and extract new insights from your data!
A spotlight on graph technology directly in your inbox.