It's no secret that managing risk in the supply chain can be a complex and daunting task. With numerous stakeholders, vast amounts of data, and ever-changing market conditions, it can be difficult to predict what might go wrong—let alone find effective ways to mitigate potential losses. In fact, many organizations feel behind the curve. According to a survey by Gartner, just 21% of respondents indicated that they had a highly resilient network: good visibility, and agility in shifting sourcing, manufacturing, and distribution activities (1).
Graph analytics and visualization have emerged as powerful tools for risk managers in procurement and operations to better understand their supply chains and help reduce any associated risks. By integrating these technologies into their tech stacks, companies can find hidden patterns and relationships within their datasets which will allow them to take meaningful steps towards reducing their exposure. In this article, we'll explore some of the key supply chain risks, look at the main challenges around supply chain risk management (SCRM), and finally take a closer look at why graph visualization and analytics are well suited for managing supply chain risk.
Managing potential risks in the supply chain is vital for the myriad businesses around the world that rely on the timely delivery of goods and materials, ranging from consumer products to pharmaceuticals to petrol and more. The interruption of the flow of goods due to unforeseen risks can not only result in financial losses but can also negatively impact a company's reputation. It can even have negative societal and economic consequences - just think of what happens when there is a drug or gasoline shortage. It is therefore crucial for companies to put in place robust risk management procedures that help identify and assess the potential issues along the supply chain. By managing and mitigating potential risks, companies can ensure smooth operations and reduce the likelihood of disruptions.
Effectively managing supply chain risks can also help organizations manage and reduce costs through the use of preventative measures - and by avoiding costly mistakes. Ultimately, ensuring the continuous flow of goods through proper risk management is essential for the success and longevity of any business.
This can be more easily said than done for many of the global organizations working with highly complex supply chains today, however. Let’s take a look at some of the key supply chain risks organizations contend with and some of the major challenges they have in effectively managing them.
Part of the challenge of effective supply chain risk management is simply the number of risks there are to manage across the chain, from raw material procurement to manufacturing products to distributing them to customers. Supply chain risks can be broadly divided into two main categories: external and internal. Let’s take a look at some of the more common ones.
External risks come from outside your organization. These are things you may not have a lot of control over, but still must be in capacity to anticipate and manage.
- Environmental risks: Natural disasters like hurricanes, floods, wildfires, and earthquakes can damage transformation infrastructure, factories, and warehouses, disrupting supply chain operations.
- Geopolitical risks: From political instability to trade wars to economic sanctions, geopolitical disruptions can increase the costs of raw materials, slow down shipping, and disrupt the flow of goods. There have been many examples of this since Russia’s invasion of Ukraine in 2022.
- Pandemics: Global health crises like the Covid-19 pandemic can cause factories to shut down, governments to impose travel restrictions, and create labor shortages.
Internal risks are the ones that are within your control. But to properly manage them, you still need the right analytics and visibility tools to avoid these risks becoming problems or disruptions.
- Quality control issues: Poor quality control can lead to defective products, increased costs, and supply chain disruptions due to returns or recalls. Quality control issues can also become compliance issues if your organization is in an industry that works with controlled substances, for example.
- Production delays: Many things can cause production delays, including machine breakdowns or factory disruptions, lack of raw materials, or labor shortages. Those delays can in turn cause disruptions across the rest of the supply chain.
- Supplier dependency: Over reliance on a single supplier can create supply chain risks if anything - such as quality issues or financial instability - befalls that key supplier.
With these many risks present all along the supply chain, it’s no surprise that they can become challenging to manage. With the current globalization of trade and the increasing complexity and interconnectedness of supply chains, the risks that can impact organizations have grown more diverse and unpredictable. Global supply chains often involve multiple tiers of suppliers, geographically dispersed facilities, and a variety of modes of transportation. Problems at one point in the supply chain can then cascade throughout the rest of the network.
Maintaining visibility over everything is also a challenge. This involves coordinating the activities of multiple organizations and stakeholders, each with their own systems and processes.
Finally, the current business environment also comes with a lot of unpredictability when you take into account factors like natural disasters, geopolitical tensions, and global pandemics. This unpredictability necessitates careful planning ahead of time.
These challenges require companies to adopt a proactive and dynamic approach to SCRM involving continuous monitoring and contingency planning. With the right strategy and tools in place, organizations can mitigate risks and keep their supply chains running like a well oiled machine.
Graph visualization and analytics are emerging as a game-changer in the area of SCRM. This technology makes it easier to gain insights into the source of risk, track dependencies and flows of materials throughout the network, raising visibility across all stages from procurement through distribution.
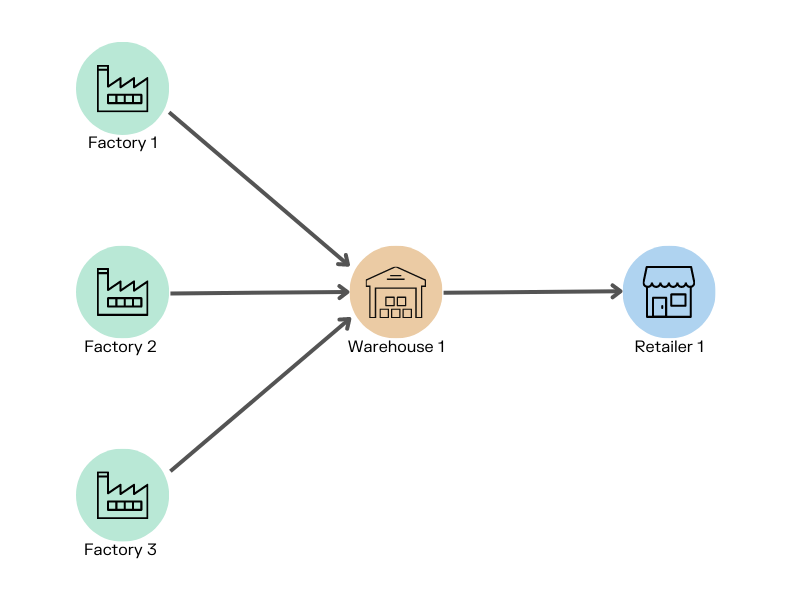
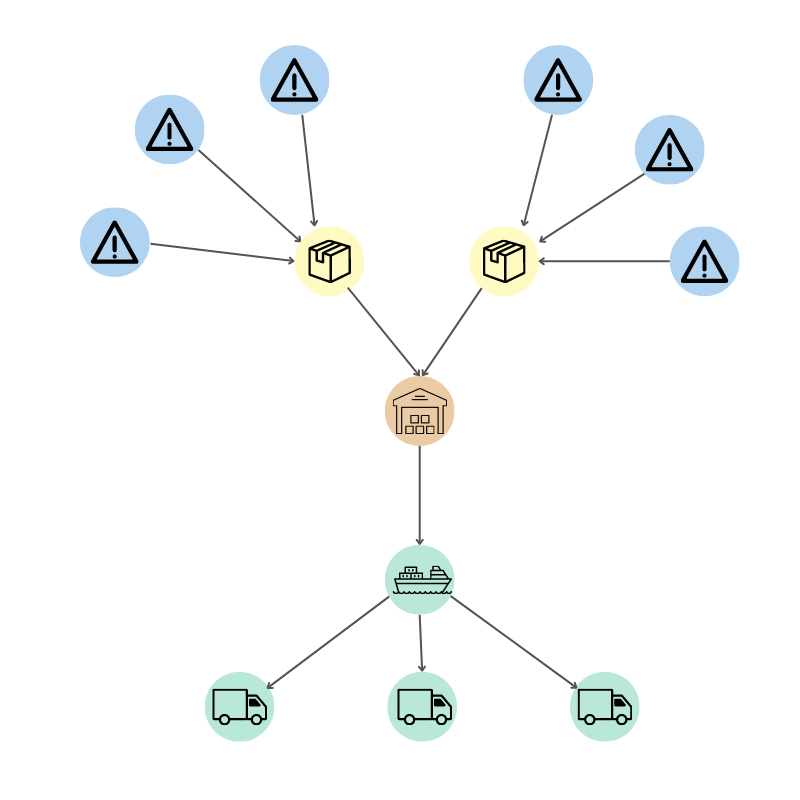
How does it work? Graph technology thrives on connections and complexity - two elements that are inherent in managing supply chain risk. In a graph, data is structured as nodes and edges. Each node represents an entity (such as a factory, a warehouse, or a supplier), and each edge represents how two nodes are linked to each other. All that data is stored within a graph database.

Graph effectively allows businesses to visually map out and analyze their supply chain, identifying potential risks and vulnerabilities. One of the biggest advantages of graph visualization and analytics is the ability to see the bigger picture. With traditional spreadsheets, it can be easy to miss crucial details or connections between different data points. The ability to visualize complex, connected data sets in real time with graph, on the other hand, enables decision makers to identify risks and opportunities that may have otherwise gone unnoticed.
The enhanced analytics capabilities of graph also present an advantage. Managers can take a deeper dive into supply chain performance, identify bottlenecks and take corrective action. They can also identify potential blockers - like over reliance on a single supplier - and put in place contingency plans. Let’s look at a couple of examples.
Most industries are subject to various compliance standards, be it around environmental regulations or regulations around controlled substances. Compliance breaches can have dire societal and economic consequences (in addition to potentially damaging a company’s reputation.)
Many organizations struggle to have visibility over the full supply chain, however, which can result in compliance issues. By offering transparency and traceability, graph visualization and analytics are a powerful tool to avoid compliance risks in the first place. This technology lets you see all the products and steps in your supply chain, and ensures you maintain that visibility every step of the way.

A big part of SCRM is anticipating potential problems and how to manage them. What if a key supplier goes out of business? What if your primary shipping route is blocked? What if a hurricane shuts down an important factory?
With graph, you can easily test out different scenarios using a supply chain digital twin. Graph algorithms let you analyze the most efficient routes between nodes, quickly finding the best alternatives in case problems arise.
Risk management in supply chains is an essential task that requires both the right strategy and tools to work efficiently. Graph visualization and analytics are an asset for organizations, providing them with deeper insight into the data they possess and enabling better decision making. Put simply, it's a powerful tool that allows businesses to safeguard their operations, better predict events, and take proactive measures while handling the challenges associated with changing market conditions.
Linkurious Enterprise, which provides a powerful and easy to use, off-the-shelf graph visualization and analytics software, offers a holistic view of the entities most relevant to your business and its relationships. It helps you get better insights on supplier dynamics to proactively manage your overall risk portfolio and ensure the security of your operations into the future. Learn more about Linkurious Enterprise, or get a demo.
(1) https://www.gartner.com/smarterwithgartner/6-strategies-for-a-more-resilient-supply-chain
A spotlight on graph technology directly in your inbox.

