Fraud - and particularly organized fraud - is a costly problem that has only become more challenging as digital transformation opens new channels for bad actors. The proliferation of sophisticated fraud schemes, such as synthetic identity fraud or complex insurance fraud, demands a robust defense system that can adapt and evolve in real-time. Machine learning and graph technology have proven a winning duo to transform the landscape of fraud detection.
Many existing detection methods lack the flexibility needed to detect the wide spectrum of fraudulent behaviors - and to accommodate the new fraud schemes that are emerging constantly. Furthermore, fraudsters adapt their behavior to fool rules-based or feature-based detection methods.
Machine learning has revolutionized how we process data and make informed decisions. Its ability to identify patterns and anomalies within vast datasets has opened new avenues for detecting fraudulent activities. However, relying solely on machine learning may leave certain blind spots, creating vulnerabilities in the fraud detection process. By layering in graph technology, you can effectively improve your machine learning algorithms to enhance your fraud detection capabilities.
In this article, we explore the value of machine learning and graph technology in the realm of fraud detection and how joining these two technologies can lead to significantly better performance. Join us as we explore how this powerful duo empowers organizations to stay one step ahead of fraudsters, safeguarding their assets, reputation, and the trust of their customers.
Legacy fraud detection systems have often relied on rules that trigger alerts - rules created based on known fraud schemes. In car insurance fraud, for example, an alert might be triggered in the case of a claim associated with a garage that had been involved in a previous fraudulent claim.
The problem: fraudsters are clever and are constantly cooking up new schemes that may not trigger existing alerts. Fraudsters also frequently work in organized groups, and it can be very difficult to see the extent of one of their schemes using just standard fraud detection technology.
Machine learning has proven an effective tool in fraud detection when applied correctly. One of the most significant strengths of machine learning lies in its pattern recognition capabilities. Unlike static rules-based systems, machine learning models can automatically adapt to new data and learn from historical incidents of fraud. By analyzing vast amounts of transactional data and customer behavior, these models can detect subtle deviations and anomalies that may indicate fraudulent activities.
Graph technology, a type of analytics that thrives on connected data, can be seamlessly combined with machine learning in a complementary approach. Graph machine learning has the potential to transform fraud detection, bringing improved efficiency and all the benefits that come with it: reduced fraud losses, improved customer trust, and more.
A graph is built to work on connected data. The essential building blocks of a graph data model are nodes and edges. A node represents an individual data point, such as a person, an address, a bank account, etc. An edge is the relationship between two nodes. For example, a person has a bank account.
In a graph data model, the connections are as important as the individual data points. Graphs are therefore an ideal tool to represent all kinds of networks - including networks of fraudsters. In displaying both direct and indirect connections, this technology makes it far more effortless to detect complex fraud patterns that would have been difficult or impossible to uncover otherwise.
The functionalities of graph and machine learning are complementary. Machine learning combines statistical and analytical techniques to classify information and spot patterns in the data. ML can go beyond static rules and scale human insights, improving learning models to make better decisions based on the cases it already processed.
Graph features can work as input for machine learning. They add a new dimension of connectivity between users, accounts, etc., tracking multiple hops across nodes and multiple paths of connection. These insights can be leveraged by machine learning models to increase the accuracy of ML algorithms. Together, graph and machine learning provide greater analytical accuracy and faster insights.
Graph also increases the explainability of machine learning, demonstrating why an ML system reached a certain decision, like why it flagged a particular insurance claim as potentially fraudulent. Because of the legal aspects associated with fraud detection, explainability is indispensable for this use case. Machine learning alone can fall short on explainability: in an interconnected, layered neural network, for example, it’s not always possible to trace the output decision to specific inputs.
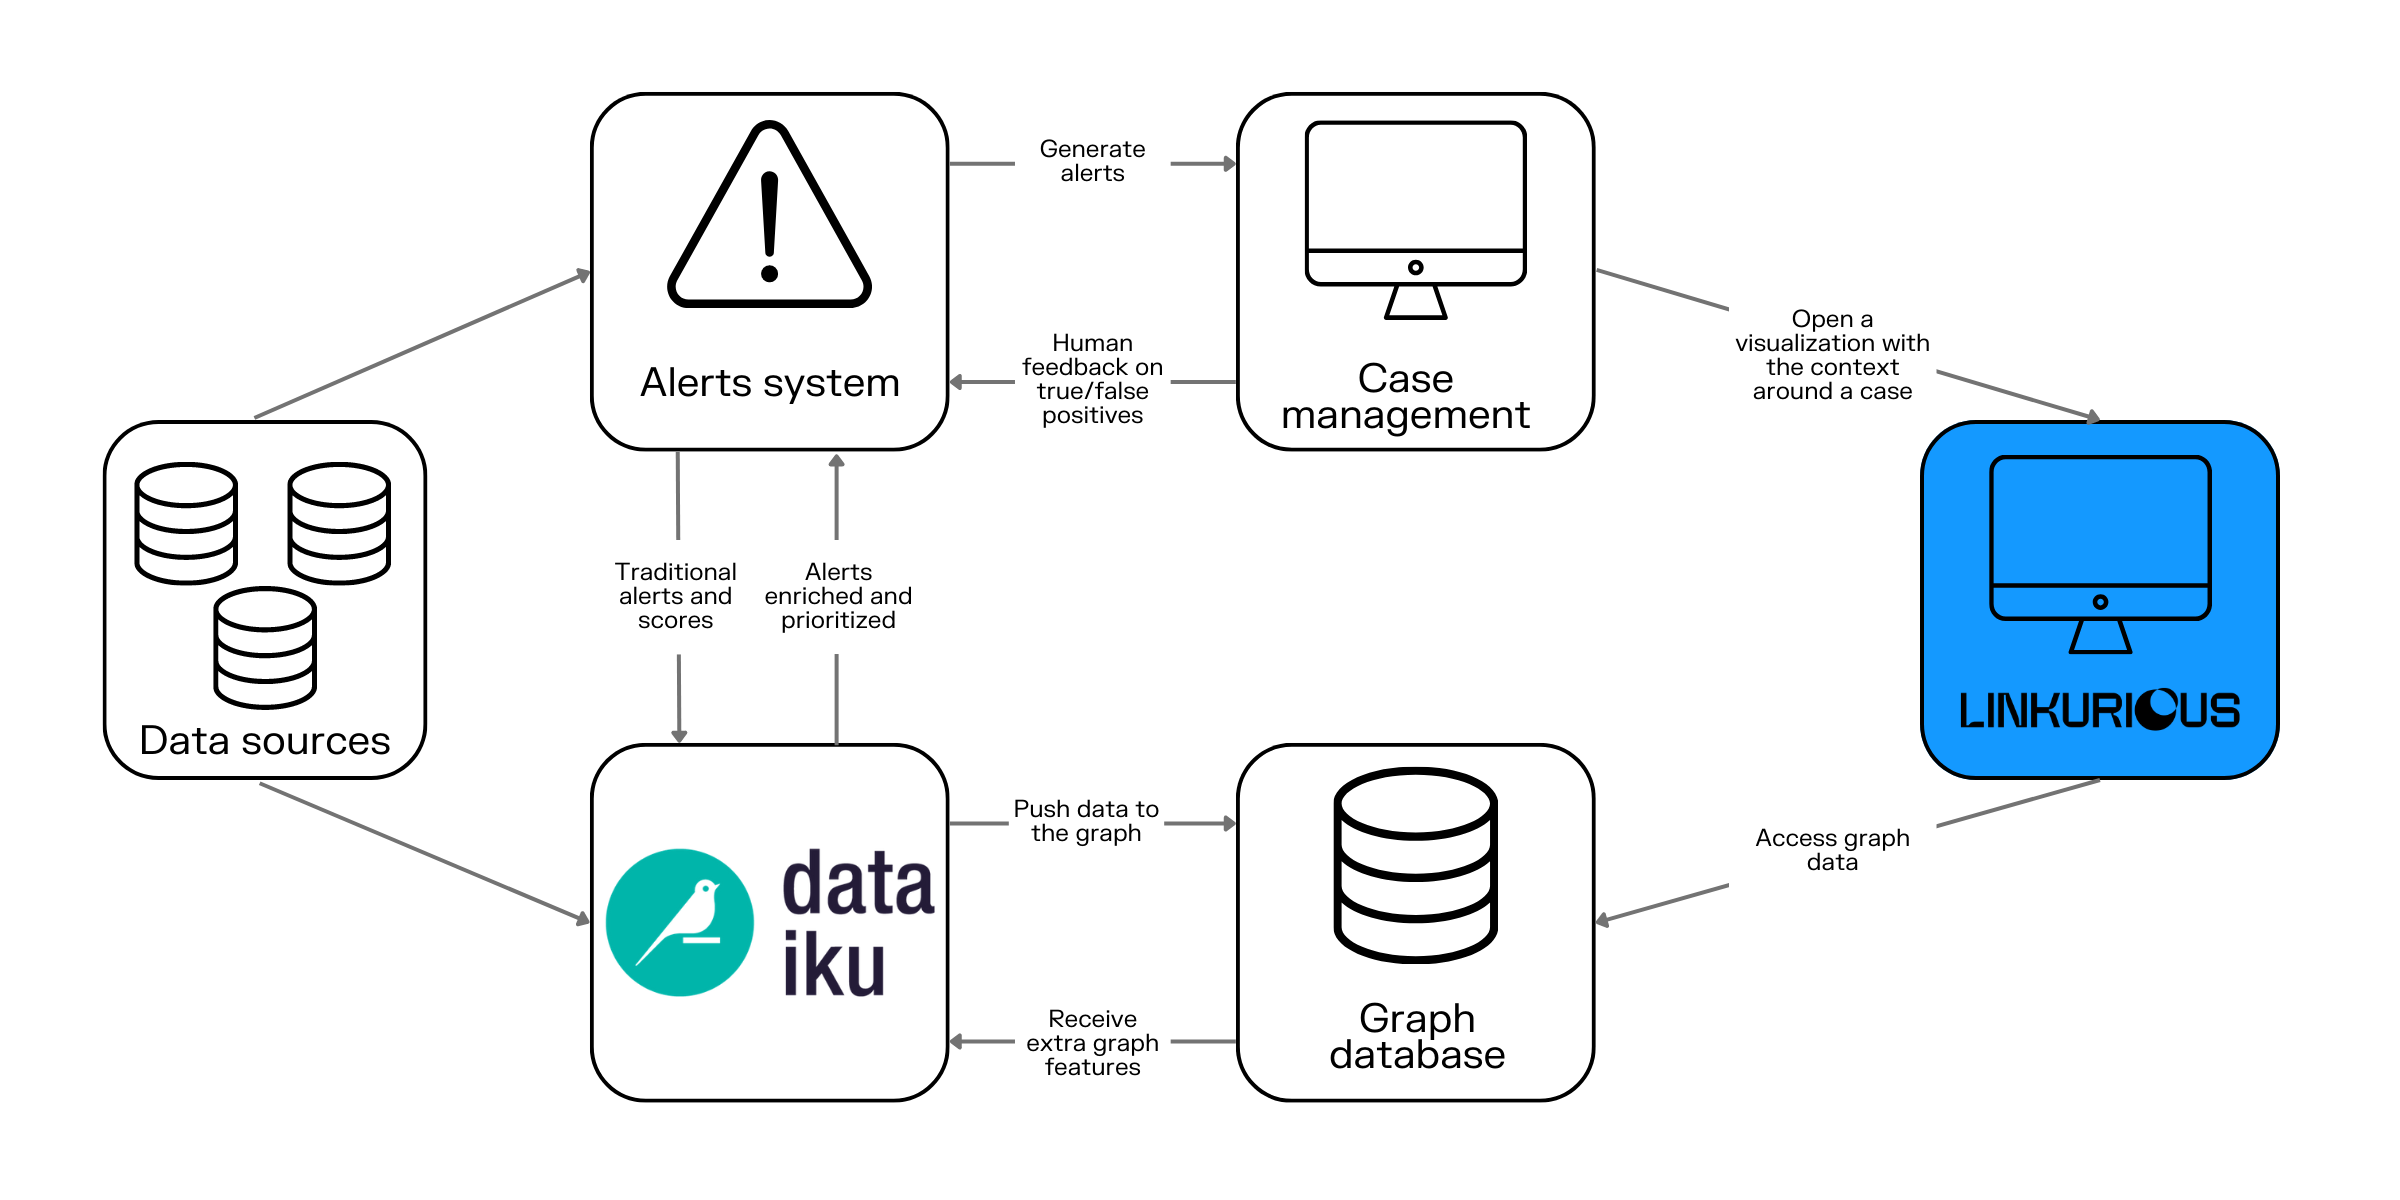
So what do these technologies look like working together? Let’s take a look at a practical example, using machine learning software from Dataiku, the Neo4j graph database, and graph analytics and visualization software from Linkurious.
First, Dataiku pulls in data from your different datasets. You can have multiple different datasets in a single project. You can then use machine learning algorithms, such as an isolation forest algorithm for anomaly detection. You can also set up an algorithm to rank or tier the alerts of the business rules or the machine learning model. This helps determine based on historical trends which alerts are most likely to end up being true cases of fraud - effectively helping reduce false positives.
It’s easy for teams to set up and design these machine learning algorithms within the Dataiku interface. And these pieces of enrichment can then be passed into the graph database using connectors.

This architecture is an example meant to showcase how to integrate machine learning and graph analytics. It’s possible to combine Linkurious’ graph analytics and visualization with other machine learning platforms or graph databases such as Amazon Neptune, Memgraph or Azure Cosmos DB.
The information generated by your graph and machine learning fraud detection system can be made available in a graph visualization tool such as Linkurious Enterprise. Graph visualization provides an intuitive way to visualize results, in turn simplifying and streamlining the investigation of your alerts. (Read about how Zurich Insurance is doing this to improve their fraud case triage efficiency.)
Specifically, the risk score computed in the ML platform can be used to easily set up and generate alerts directly in Linkurious Enterprise. These alerts can be visually investigated and eventually confirmed or dismissed. These human insights can also be captured via Linkurious Enterprise integrations, providing a feedback mechanism to the machine learning algorithm.
The combination of machine learning and graph technology for fraud detection proves to be a formidable alliance, offering a powerful edge against the ever-evolving fraud landscape. By harnessing the exceptional pattern recognition and real-time processing capabilities of machine learning, and complementing them with the interconnected insights provided by graph technology, businesses can achieve significantly better performance in detecting - and in turn preventing - fraud. This dynamic duo not only helps organizations safeguard their assets, reputation, and the trust of their customers but also empowers them to proactively stay one step ahead of fraudsters.
Explore graph technology further and learn more about Linkurious Enterprise today.
A spotlight on graph technology directly in your inbox.


