A significant number of organizations today rely on data analytics to support their decision making. But not all data analytics are created equally. Data without proper context has limited value and can lead to incomplete or misguided conclusions.
Traditional static dashboards present information in isolation, creating limitations that can impact business outcomes. When data remains siloed across different systems and departments, organizations miss critical information. And all too often, traditional data analytics fails to contextualize data, creating blind spots and gaps in understanding.
This is where contextual analytics comes into play. By bringing relevant context directly into workflows, contextual analytics enables more informed decision making. Rather than users needing to piece together information from multiple sources, contextual analytics presents a complete picture that supports more reasoned choices.
This article examines what contextual analytics means for modern organizations, explores how graph analytics delivers the essential context organizations need, and demonstrates why contextual analytics has become fundamental to successful decision intelligence practices.
Contextual analytics combines and analyzes multiple datasets to identify patterns, anomalies, or risks that would remain invisible when examining data in isolation. Using technology like graph analytics and visualization, this approach brings together relevant information from various sources, eliminating the need for users to switch between different systems or manually correlate data points to perform meaningful analysis. Crucially, it also provides information on the relationships between data, providing context essential for decision making.
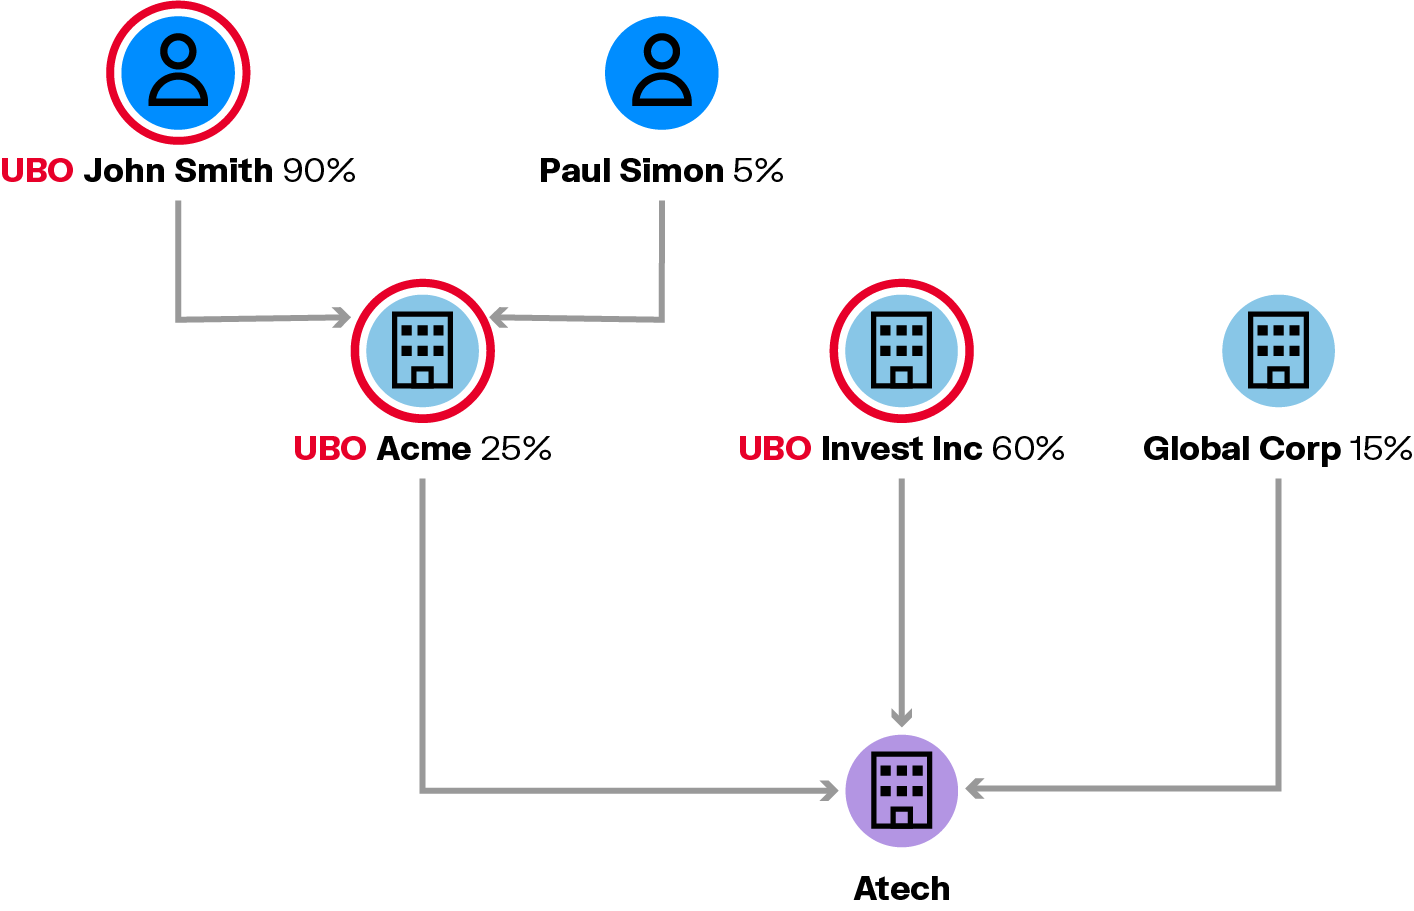
Consider anti-money laundering analysis as an example. A traditional approach might flag individual transactions that exceed certain thresholds or match known suspicious patterns.
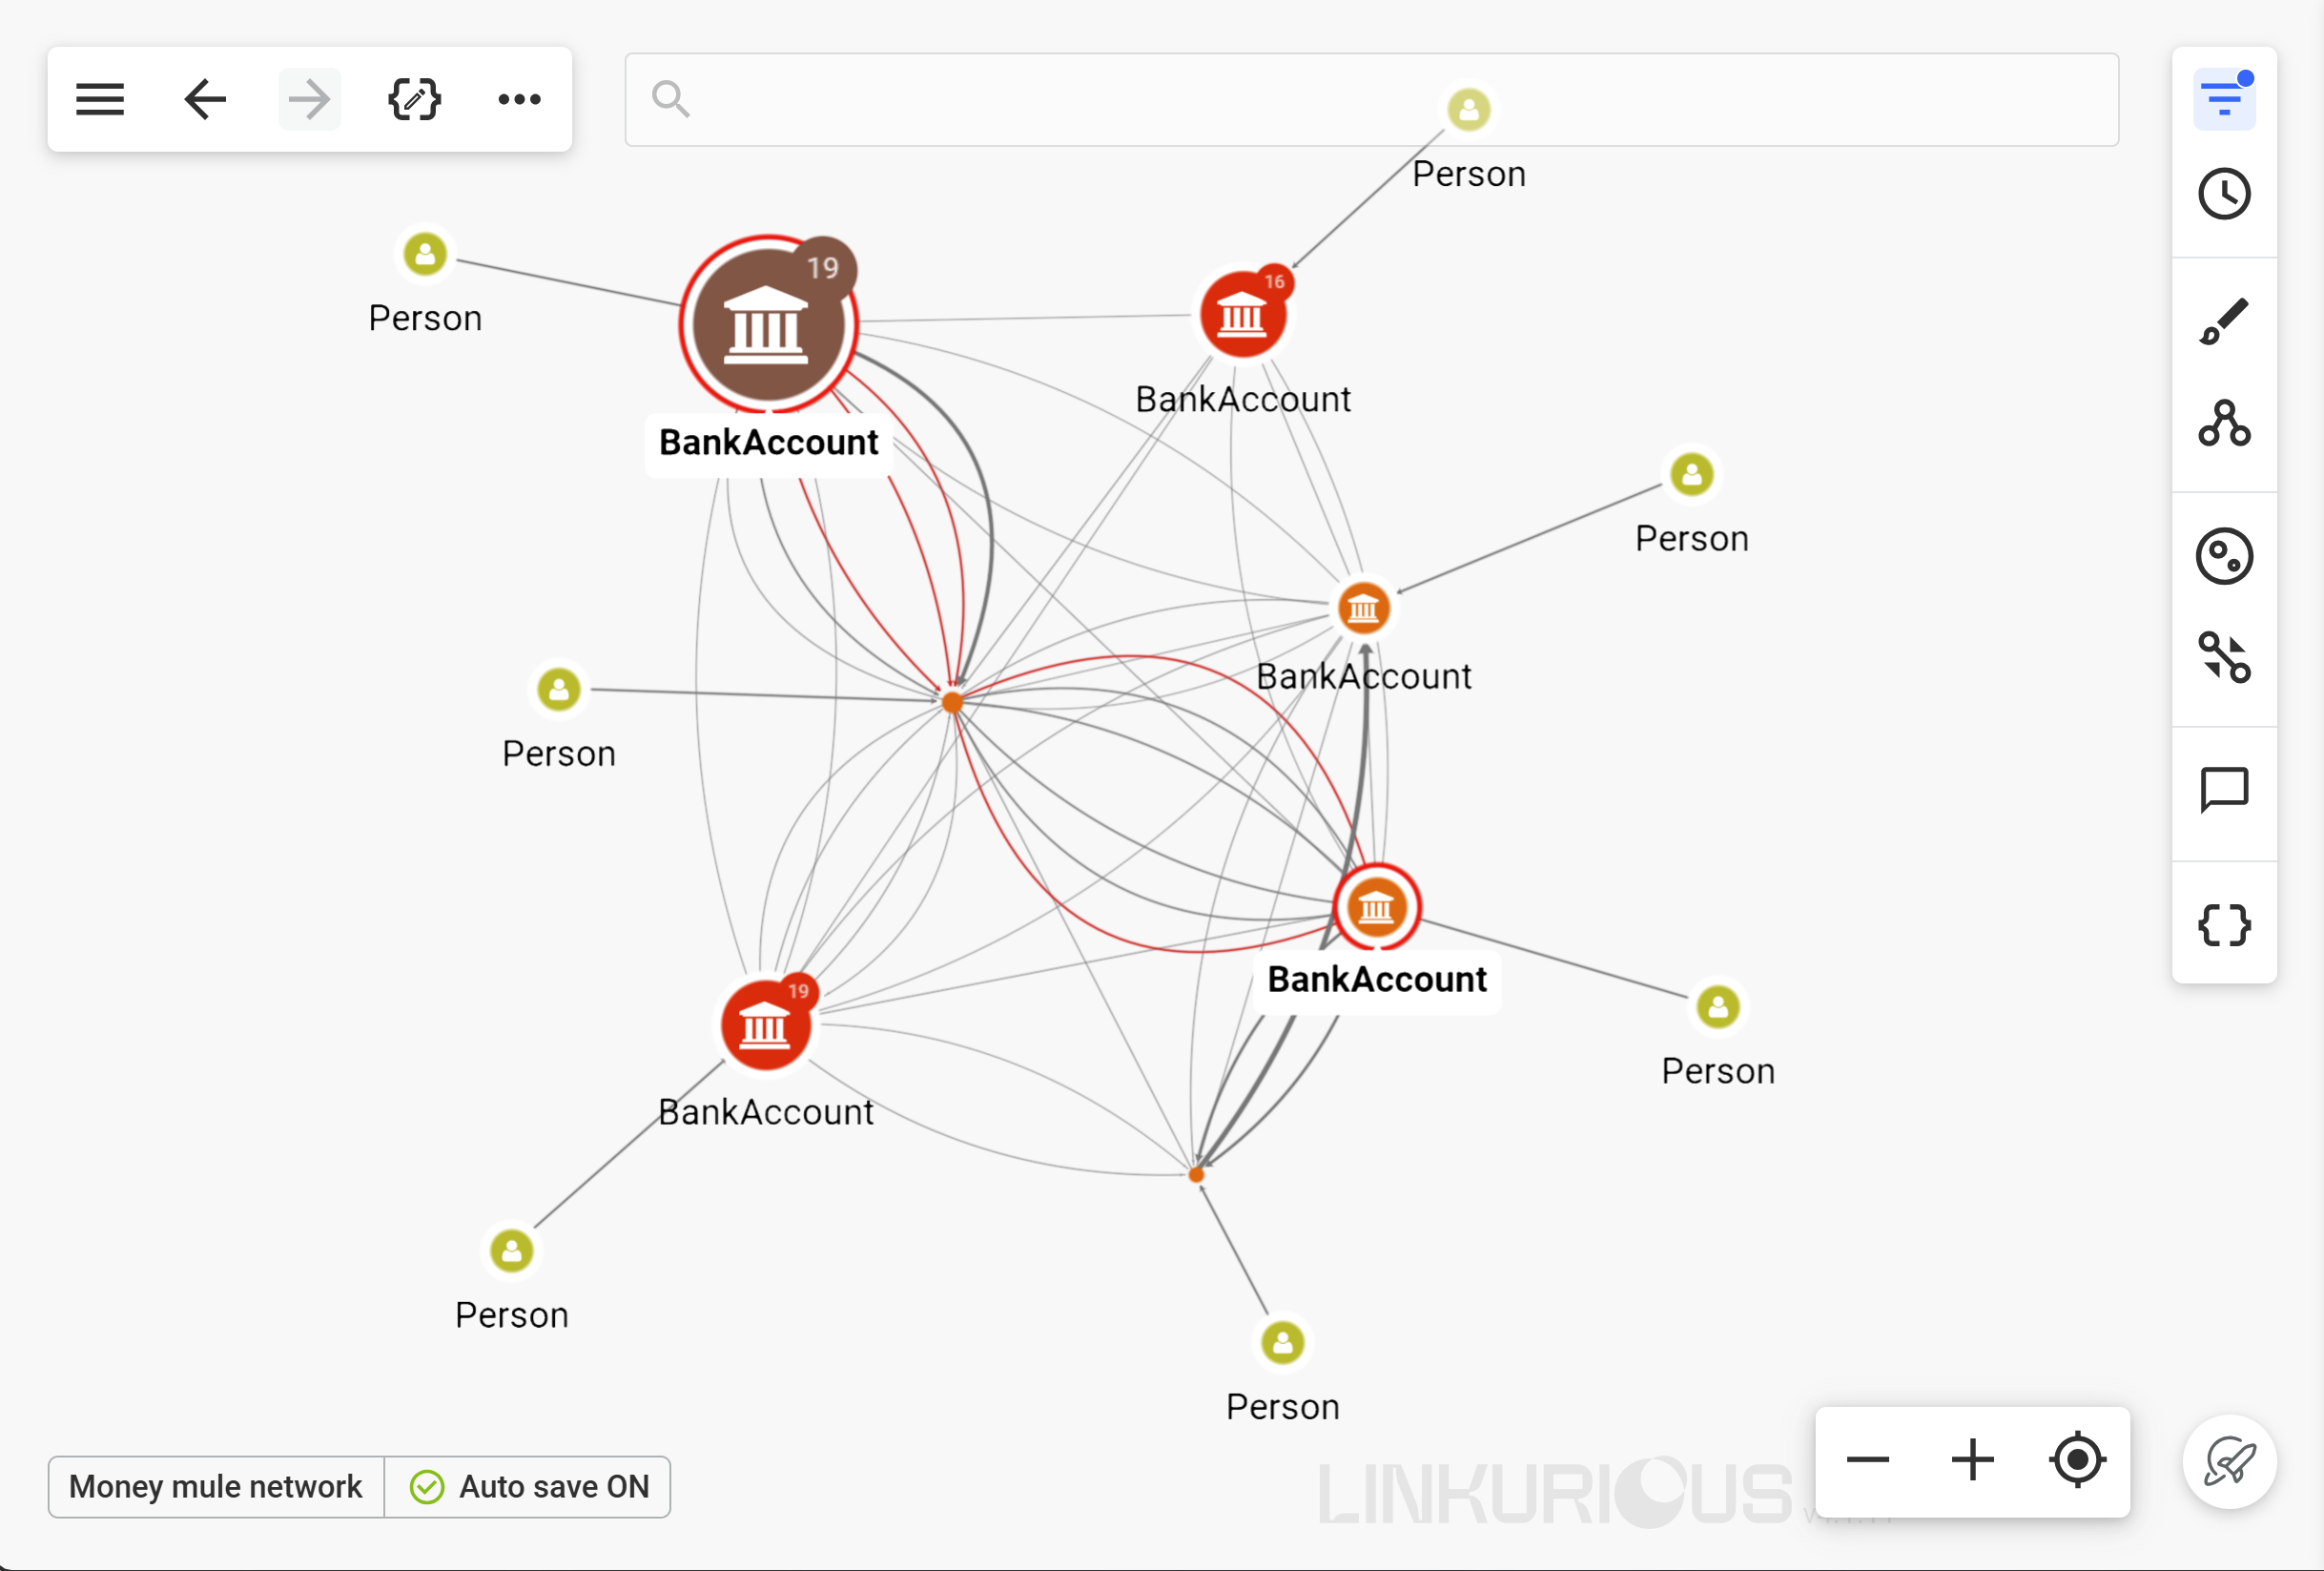
Contextual analytics takes this further by examining the relationships between accounts, the timing of transactions across multiple parties, geographic patterns, and historical behaviors. When a series of seemingly normal transactions occurs between connected accounts in rapid succession, contextual analytics can identify this as potentially suspicious activity that individual transaction monitoring would miss.
The power lies in connecting the dots between related data points. A single transaction worth $9,000 might appear normal. But when viewed alongside similar transactions from the same account to related parties over several days, a pattern that could be related to smurfing or money muling becomes clear. Contextual analytics provides this broader view, enabling analysts to see the complete picture without manually piecing together different data points.
Many analytics systems and tools fall short because they consider data points or data sources in isolation. These systems typically focus on individual metrics or predefined scenarios, missing the complex relationships and dependencies that exist between different data elements. When analysts need to understand the full context of a situation, they must manually gather information from multiple sources, increasing the time required for analysis and the risk of overlooking important connections.
This fragmented approach may create several problems:
- Decision makers may base their choices on incomplete information, leading to suboptimal outcomes.
- Teams spend excessive time gathering and correlating data instead of focusing on analysis and action.
- Important patterns that emerge from the relationships between data points remain hidden, potentially missing opportunities or failing to identify risks.
Contextual analytics addresses these challenges by delivering several key benefits:
- Improved decision making: With access to complete contextual information, decision makers can base their choices on a fuller understanding of the situation. This leads to more confident decisions and better outcomes across the organization.
- Greater efficiency: By automatically bringing together relevant data sources, contextual analytics reduces the time analysts spend chasing after insights in their data. Teams can focus their efforts on interpretation and decision making rather than manual data correlation
- Increased accuracy: By considering the full context rather than isolated data points, organizations can identify patterns and relationships that traditional analytics miss. This leads to more accurate insights and reduces the risk of false positives or missed opportunities.
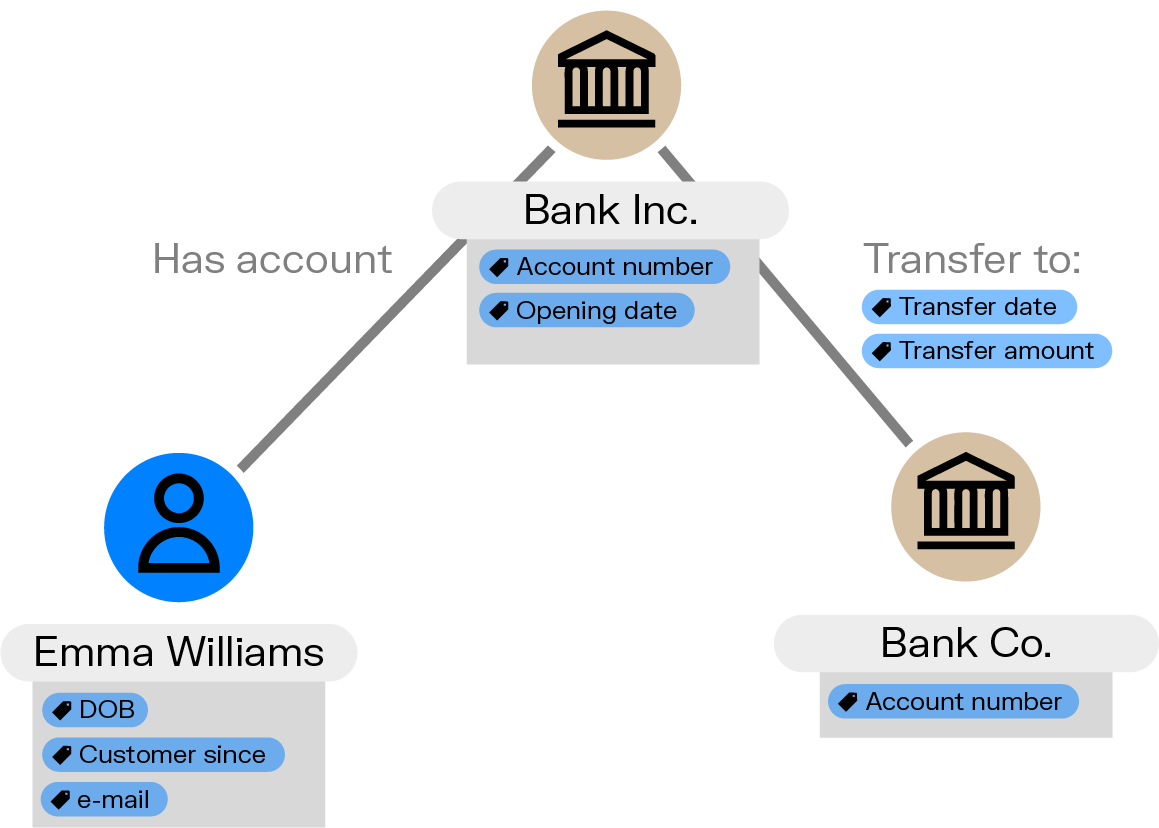
Graph analytics provides one of the most effective approaches for delivering contextual insights. Unlike traditional databases that store information in tables and rows, graph databases represent data as networks of connected entities. This structure naturally captures the relationships between different data points, making it ideal for contextual analysis.
Graph analytics examines the relationships and connections between entities in a dataset. In a graph structure, entities (such as people, accounts, or devices) become nodes, while the relationships between them become edges. This approach allows analysts to explore complex networks and identify patterns that emerge from the connections rather than just the individual data points. It is particularly valuable for scenarios where relationships matter as much as the entities themselves.
Graph analytics and visualization excel at providing context at a glance because it helps showcase and analyze the relationships that exist in real-world data, visually and at scale. When investigating a potential fraud case, for example, graph analytics can show not just the suspicious transaction, but also the network of accounts, the timing of related activities, and the patterns that connect seemingly separate events.
This approach reveals context through several mechanisms. Graph analytics can identify clusters of related activity that might indicate coordinated behavior. It can trace the flow of transactions, communications, or other activities across multiple degrees of separation. It can also detect anomalies in relationship patterns, such as accounts that suddenly become highly connected or entities that bridge previously separate networks.
When layering in a graph visualization component, this kind of pattern and anomaly detection becomes intuitive.
Decision intelligence represents the evolution of business intelligence from descriptive reporting to prescriptive guidance. While traditional BI systems tell you what happened, decision intelligence systems help you understand why it happened and what you should do next. Contextual analytics provides the foundation for this advanced capability.
Powered by native graph technology, Linkurious Decision Intelligence platform, is built to deliver contextual insights for swifter, more accurate decision making. It transforms siloed, fragmented data into a valuable source of truth, and lets decision makers go beyond individual data elements to explore the web of relationships surrounding them across multiple dimensions - understanding how they fit into the bigger picture.
Natively incorporating graph visualization and exploration as part of a comprehensive decision intelligence tech stack empowers organizations to maximize insight extraction from their data assets. It transforms data into instantaneous context that can be understood and actioned upon at every level for driving more intelligent decisions.
Organizations across industries are using graph-native contextual analytics to improve operations and decision making capabilities.
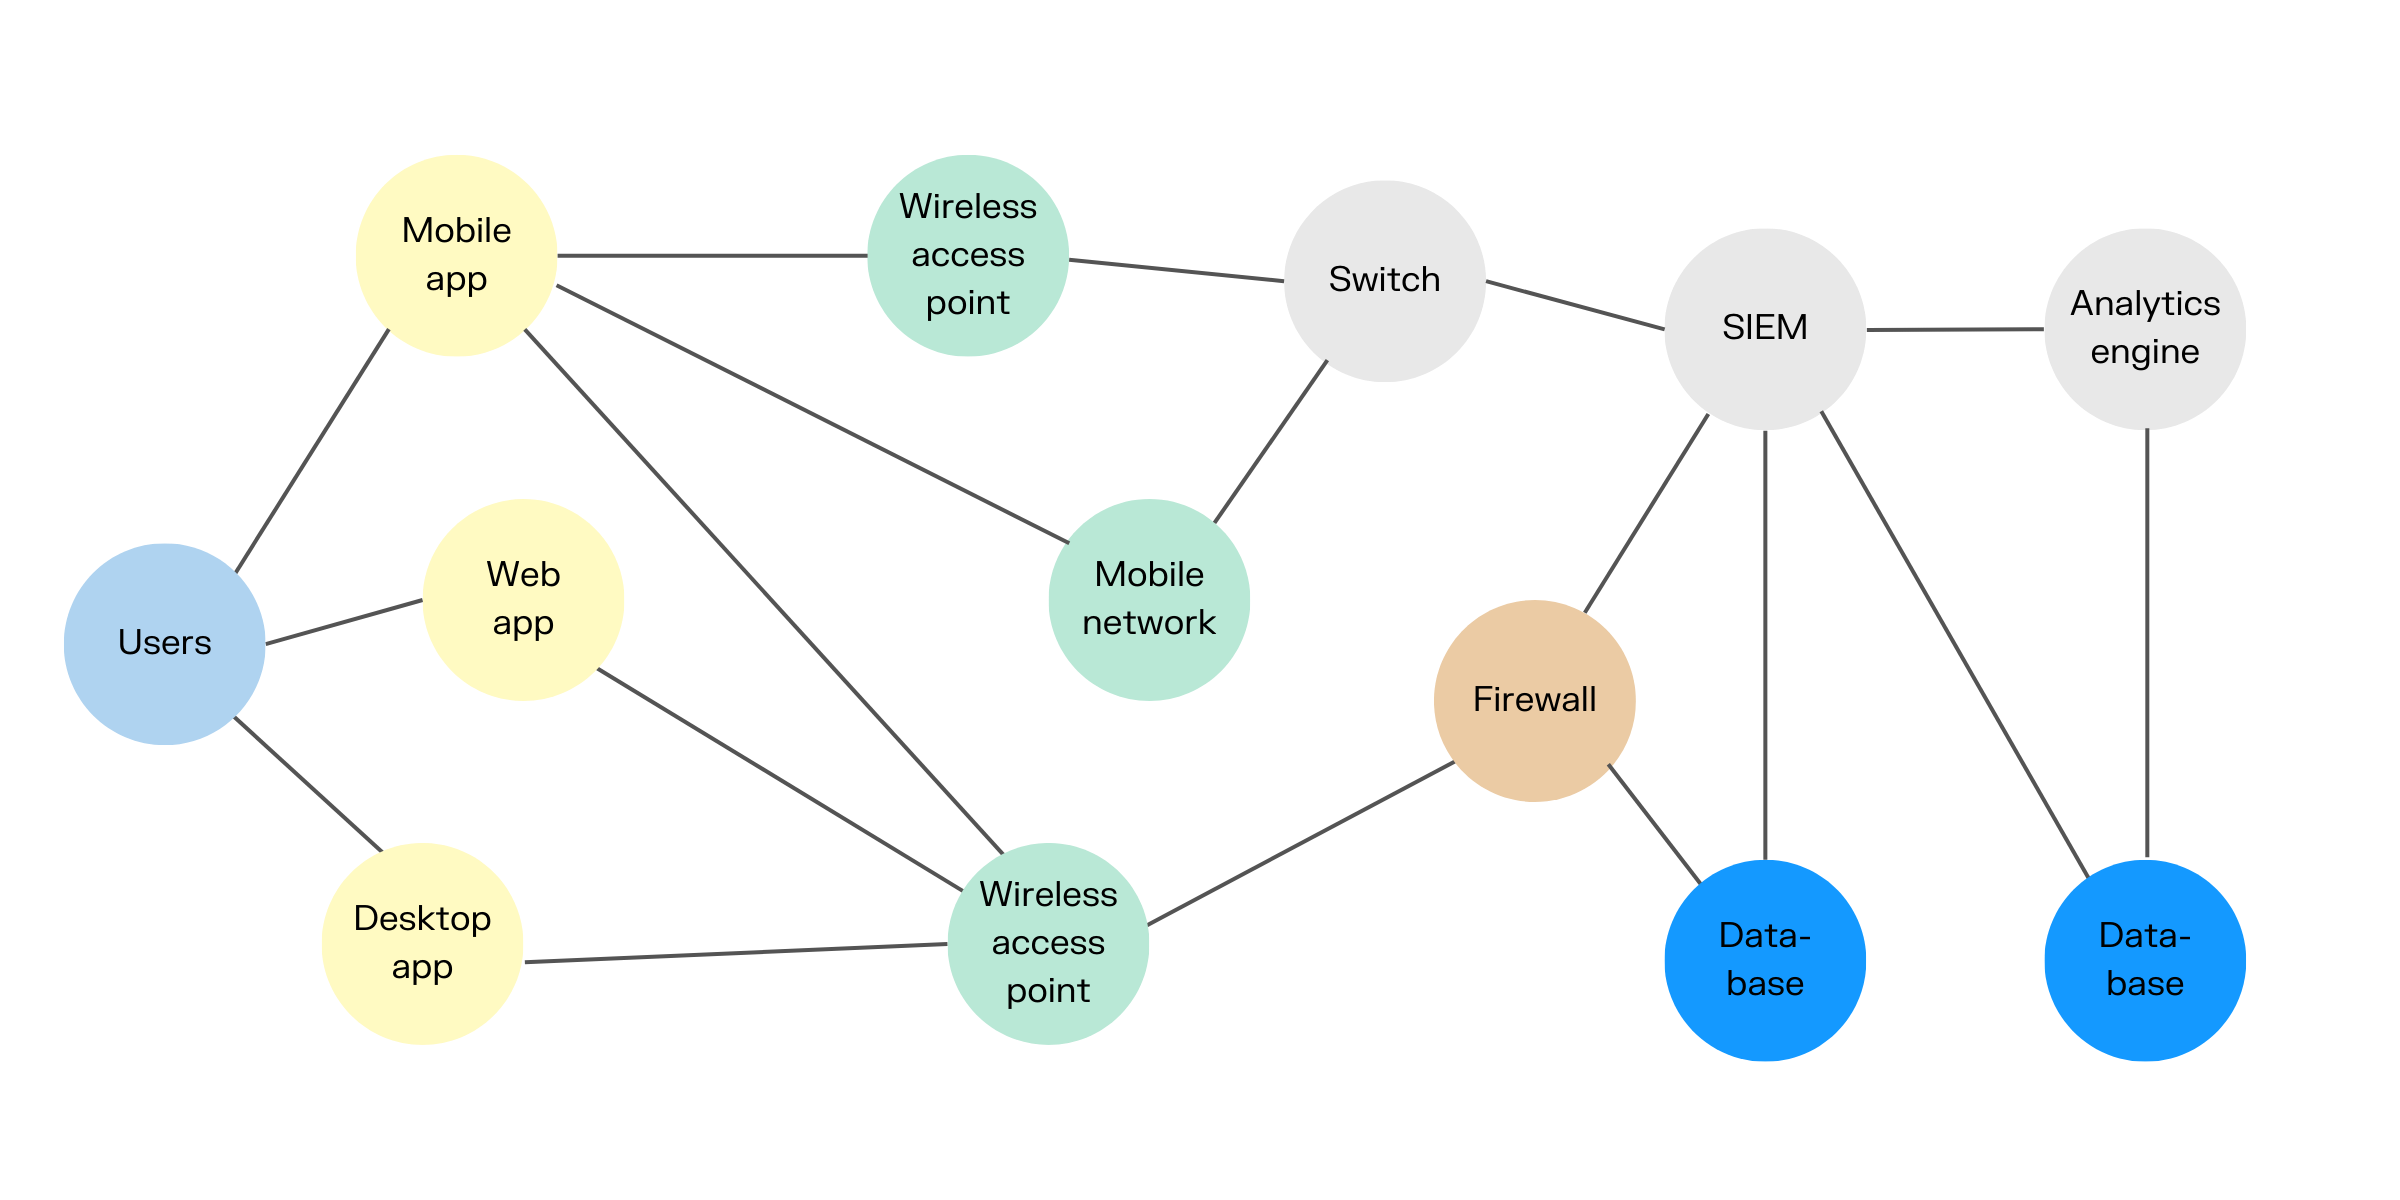
Cybersecurity teams use contextual analytics to identify sophisticated threats that traditional rule-based systems miss. By analyzing user behavior patterns, network traffic, system access logs, and threat intelligence feeds together as a graph, security analysts can detect advanced persistent threats and insider risks.
Government agencies and law enforcement organizations rely on contextual analytics to connect seemingly unrelated pieces of information. By analyzing communication patterns, financial transactions, travel records, and social connections as an interconnected graph, analysts can identify networks of interest and predict potential threats.
Financial institutions use contextual analytics to meet regulatory requirements while minimizing false positives. By combining transaction data with customer profiles, business relationships, and market conditions, compliance teams can identify genuine risks while reducing the burden of investigating legitimate business activities.
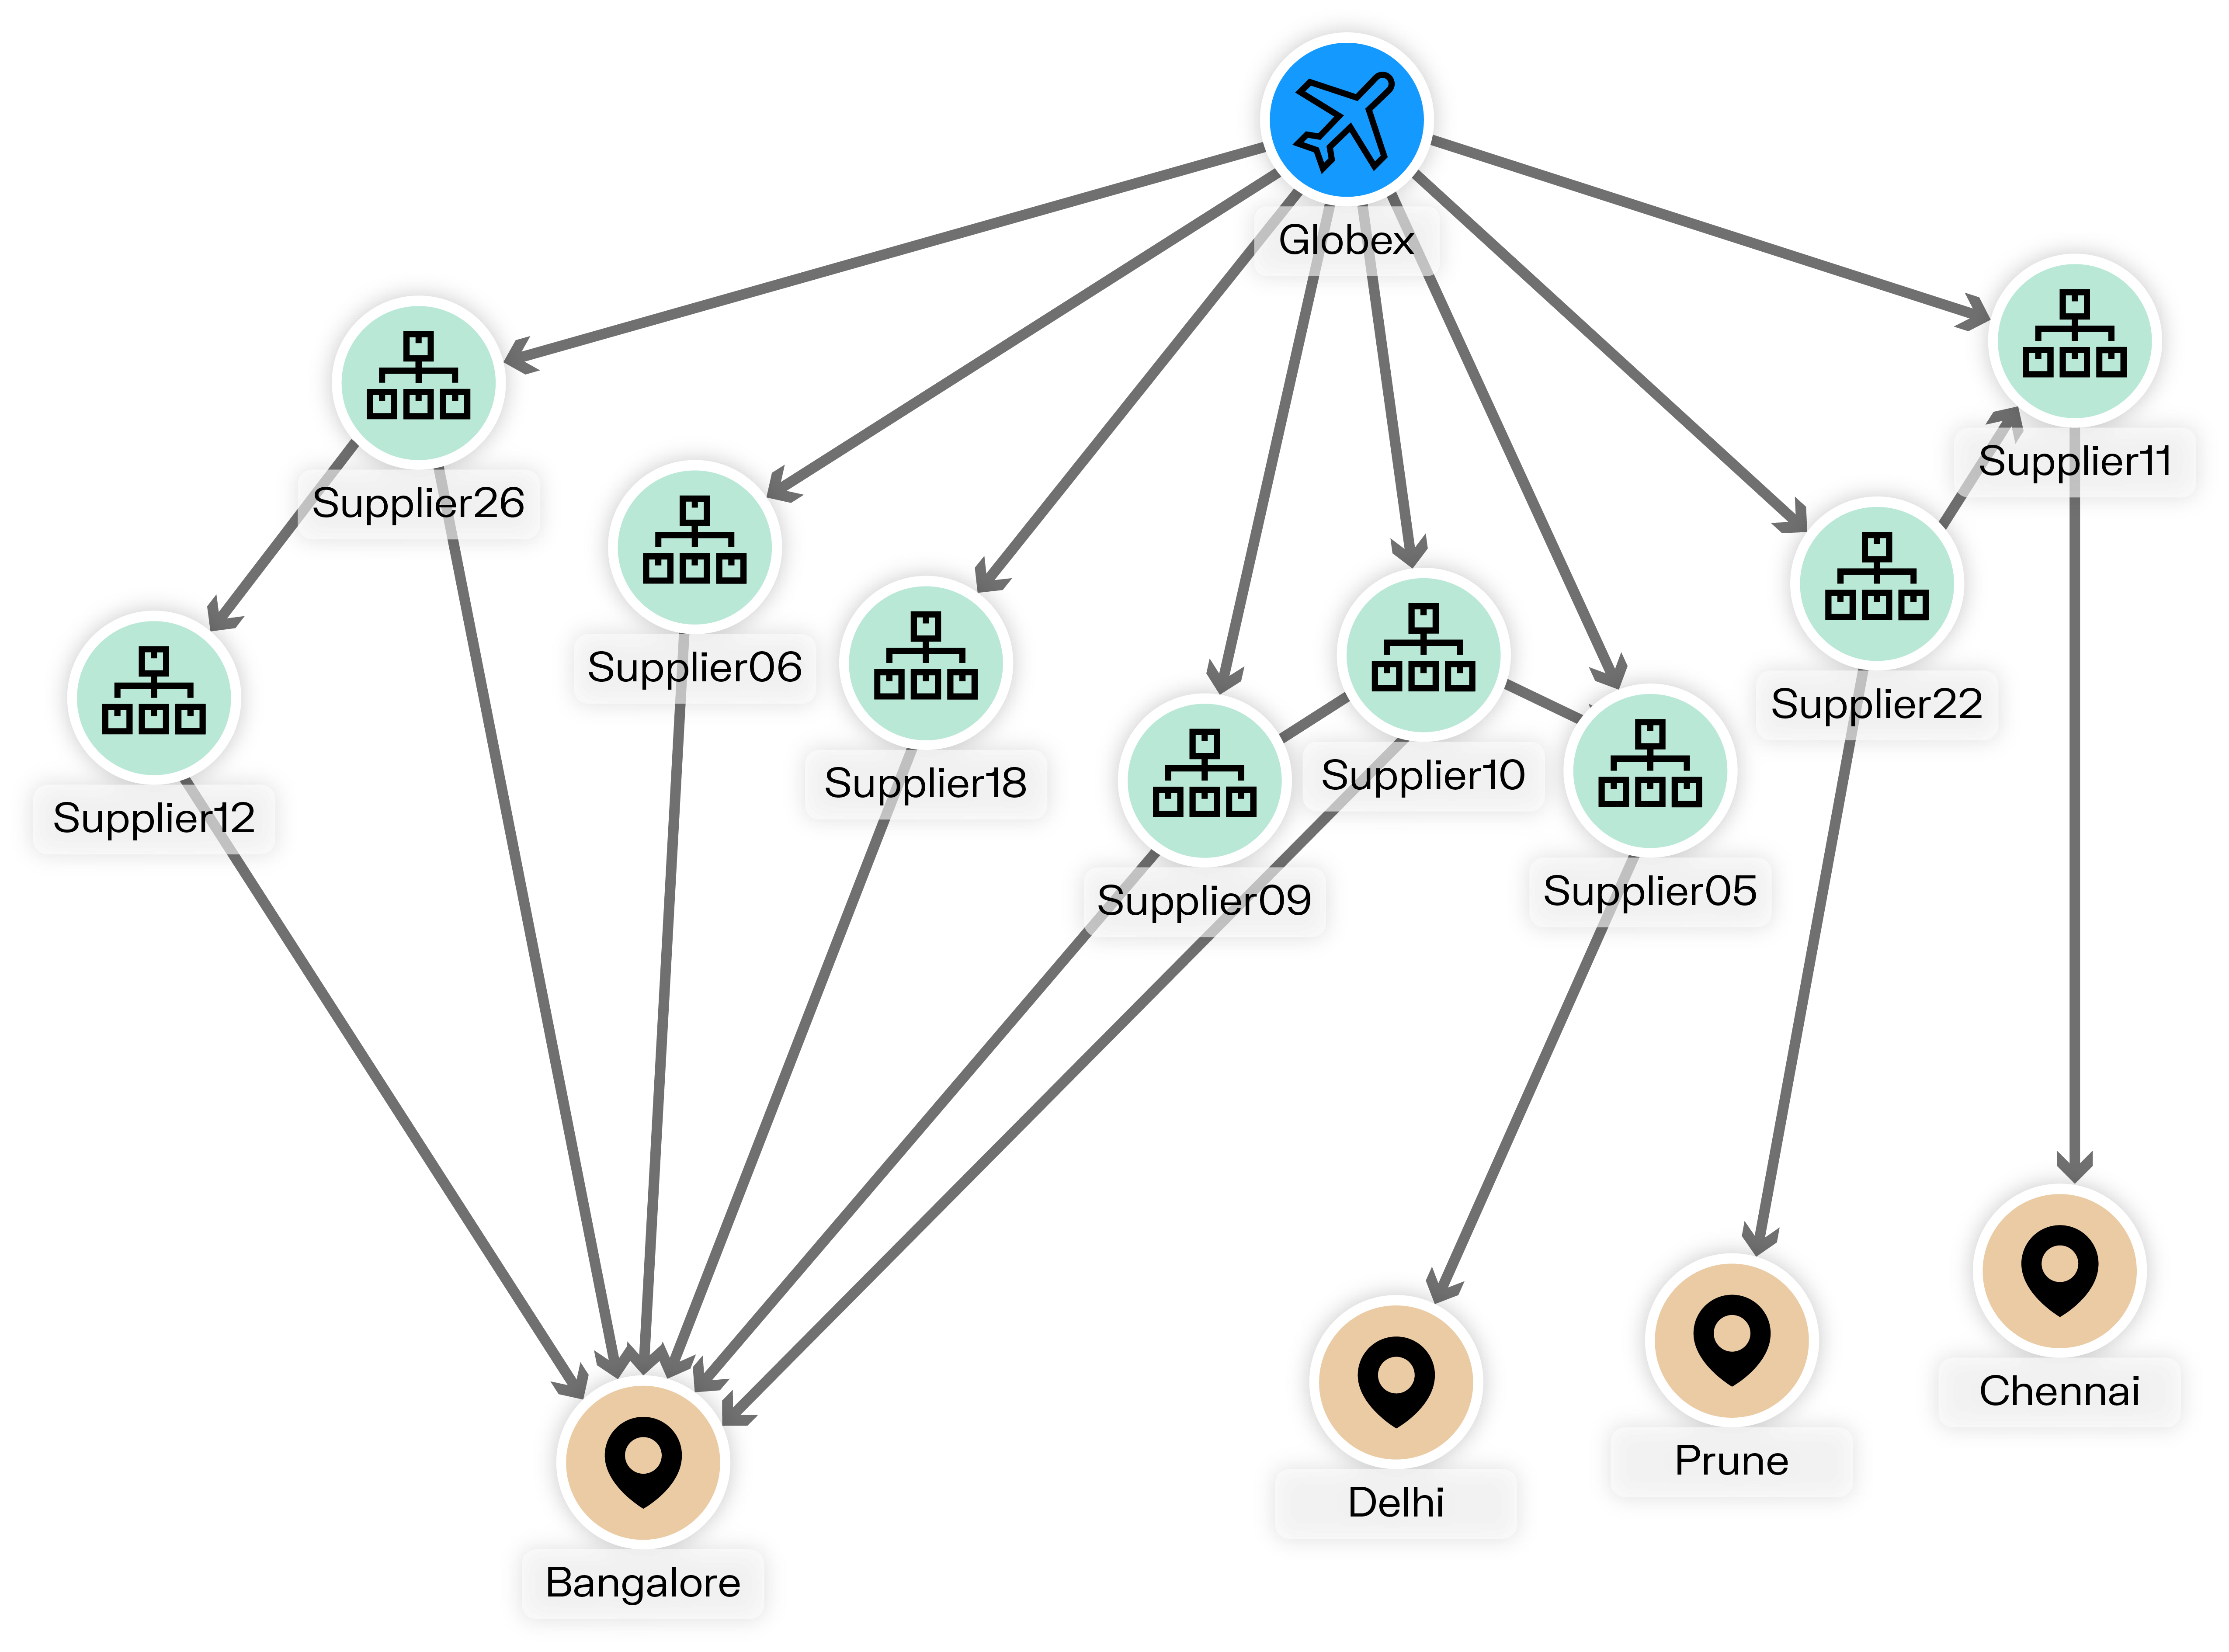
Companies use contextual analytics to optimize their supply chains by analyzing supplier performance, transportation costs, inventory levels, and market demand together as a network. When a key supplier shows signs of financial distress while demand for their products increases, contextual analytics helps procurement teams identify alternative sources before disruptions occur.
Contextual analytics represents a fundamental shift from traditional data analysis approaches. By transforming siloed, fragmented data into valuable sources of truth, contextual analytics enables organizations to go beyond individual data elements and explore the web of relationships that provide the complete picture. This approach delivers the efficiency, accuracy, and transparency that modern decision makers need to base their choices on comprehensive understanding rather than incomplete information.
Graph analytics provides the structural foundation needed to capture and analyze these complex relationships effectively. When combined with intuitive visualization capabilities, graph-native decision intelligence platforms empower organizations to extract maximum insight from their data assets, transforming information into instantaneous context that can be understood and acted upon at every level. Organizations that embrace contextual analytics today position themselves to make more intelligent decisions and achieve better outcomes in an increasingly data-driven business environment.