Transforming social benefits fraud detection & investigation: how a French agency leverages advanced technology
Due to the sensitive nature of the data handled by this agency, which works will million of beneficiaries, this client requested that we publish this case study anonymously.
Analysts and investigators investigating cases of sophisticated, organized social benefits fraud find themselves up against professionalized groups who regularly change tactics to fly under the radar.
Fighting savvy fraudsters requires quickly and efficiently analyzing large amounts of data to track down and investigate the complex and sometimes hidden connections that may indicate suspicious activity. Fraud detection and investigation is, in many ways, a connected data problem.
For the dozens of auditors in the anti-fraud team at a French social benefits agency, graph visualization and analytics technology combined with machine learning capabilities have proven particularly game changing in fostering more efficient benefits fraud investigations and in preventing more fraud from occurring in the first place, ultimately preventing the embezzlement of taxpayers' money.
The anti-fraud team at the government agency finds themselves up against an increasing amount of fraud. Organized fraud is also far more costly than small-time fraud, amounting to an average of 2-5% of social security budgets (1), so finding the most efficient methods of investigating and preventing fraud is of critical importance.
Faced with the highly connected nature of both networks of fraudsters and the data associated with organized fraud, the team at the agency decided to add graph visualization and analytics to their anti-fraud arsenal to improve their efficiency today and prepare for future fraud challenges.
Effectively, with increased digitization of the agency’s processes - resulting both in vastly more data and more opportunities for bad actors - they needed to be able to quickly analyze and explore their data. Graph tools like Neo4j graph database and Linkurious Enterprise graph visualization and analytics software enabled them to do this.
The ability to create alerts powered by graph analytics within Linkurious Enterprise has helped streamline the fraud detection process for the agency. Auditors can set up alerts in their graph visualization and analytics tool as soon as they detect a new type of suspicious pattern, allowing them to take action as soon as fraudsters devise a new scheme. Alerts then automatically generate cases related to the patterns of behavior that are of interest to them - even sophisticated patterns involving complex connections - which are available for review for the agency’s whole audit team.
In the near future, the agency imagines using multi-model alerts to gain even more sophistication in their alerting. Multi-model alerts will enable auditors to combine multiple rules of detection, written as graph patterns, around an entity of interest in one single alert. Thanks to the case deduplication feature, matches relating to the same entity will be consolidated in one comprehensive case. By consolidating alerts, analysts can avoid working on duplicate cases, helping to optimize their investigative work.
The French agency works with tens of millions of nodes and over 80 million relationships within their graph technology set-up. They rely on a complex data model, and many different types of data come into play in their investigations.
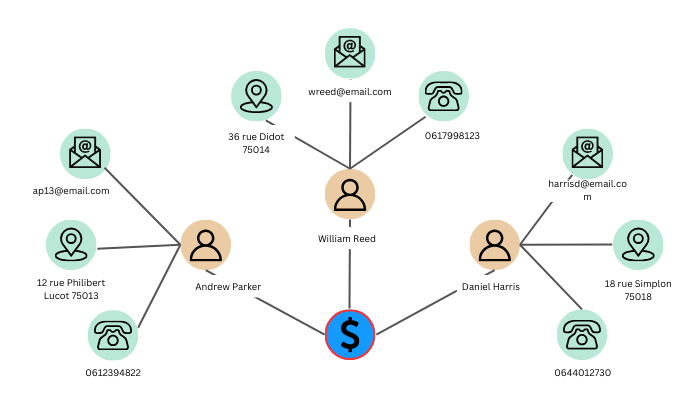
All this data is essential in detecting myriad types of fraud. These can include use of fake IDs or false documents, or groups of colluding individuals receiving benefits despite residing outside of France. Each of these fraud typologies requires auditors to piece together many different indicators and pieces of information. With graph technology, they are able to do this in a way that is fast and intuitive.

The agency’s auditors have found that querying data with a tool like Linkurious Enterprise delivers answers very quickly, saving them precious time in their investigations. Linkurious Enterprise enables them to visualize and analyze all the connections and related information surrounding an entity of interest and uncover suspicious connections between multiple entities far more easily than had been possible before adopting this technology. Being able to process this data analysis visually also effectively speeds up investigations.
The tool also lets auditors filter their data to see only the information most pertinent to their investigation. Previously they had relied on Excel to do this manually, which was far more time consuming.
Together, these features have enabled analysts to gain a great deal of time in their investigations.
Graph technology has also improved the agency’s ability to stay one step ahead of sophisticated fraudsters. The organization had encountered some especially complex fraud patterns that were challenging to spot using their previous detection methods, such as fraudsters hacking into the system to receive benefits in the place of legitimate beneficiaries. With graph putting a focus on the connections within data, they are able to proactively spot this type of behavior and prevent such complex fraud schemes from occurring in the first place.
The agency’s graph solution has helped them scale their anti-fraud detection systems. As they detect new fraud schemes, auditors can quickly and independently develop new alerts for those patterns, creating a positive feedback loop.
To boost the power of their graph-based fraud detection and investigation solution, the agency also uses machine learning technology and has added Dataiku to their stack. Machine learning algorithms help them detect certain types of frauds - such as fraud on new applications - and the risk scores generated by machine learning can be fed into their graph setup.

Their graph detection models can then be shaped by the information fed in by Dataiku. Auditors can access all their alerts - graph and machine learning - in one place, without having to switch between tools, thereby streamlining their workload and increasing overall efficiency.
In a world with increasingly sophisticated fraud schemes hidden within masses of connected data, new technology such as graph visualization and analytics and machine learning are powerful tools to stay one step ahead of the fraudsters looking to take advantage of social benefits systems. By delivering insights faster, in an easy-to-understand format, and in a way that is scalable, graph-powered anti-fraud solutions help social benefits agencies stop fraudsters in their tracks today while preparing for the fraud challenges of tomorrow.
(1) https://www.rand.org/content/dam/rand/pubs/corporate_pubs/CP800/CP806/RAND_CP806.pdf
A spotlight on graph technology directly in your inbox.


