A knowledge graph is a structured representation of information that organizes data into a network of interconnected entities and their relationships. The entities in a knowledge graph represent objects, concepts, events, etc., connected by edges that show the context of how they relate to each other.
The structure of a knowledge graph lets it capture complex, multi-dimensional relationships between different pieces of information.
Knowledge graphs’ way of storing, managing, and querying diverse sets of data mimics human understanding of the world. By representing information in an interconnected way, knowledge graphs provide a foundation for various applications in information management and artificial intelligence. They enable more intuitive data exploration and the discovery of hidden patterns, making them valuable across numerous fields and industries.
You almost certainly interact with platforms or products that use knowledge graphs in your everyday life. They power search engine technology, where Google’s Knowledge Graph is used to instantly surface answers to any of your search queries like “best Japanese restaurants in my city” or even “how to build a knowledge graph”. They are also behind recommendation engines in online shopping platforms and media platforms like Netflix or Spotify, helping you find what to buy, watch, or listen to.
This article explores how knowledge graphs work, along with a deeper look at their benefits and applications across industries.
Knowledge graphs operate on a graph data structure, consisting of nodes (representing entities) and edges (representing relationships) that connect the nodes. This structure allows knowledge graphs to represent complex relationships between different entities in a flexible and intuitive manner. These building blocks create interconnected webs of information that mimic the way our brains connect ideas and concepts.
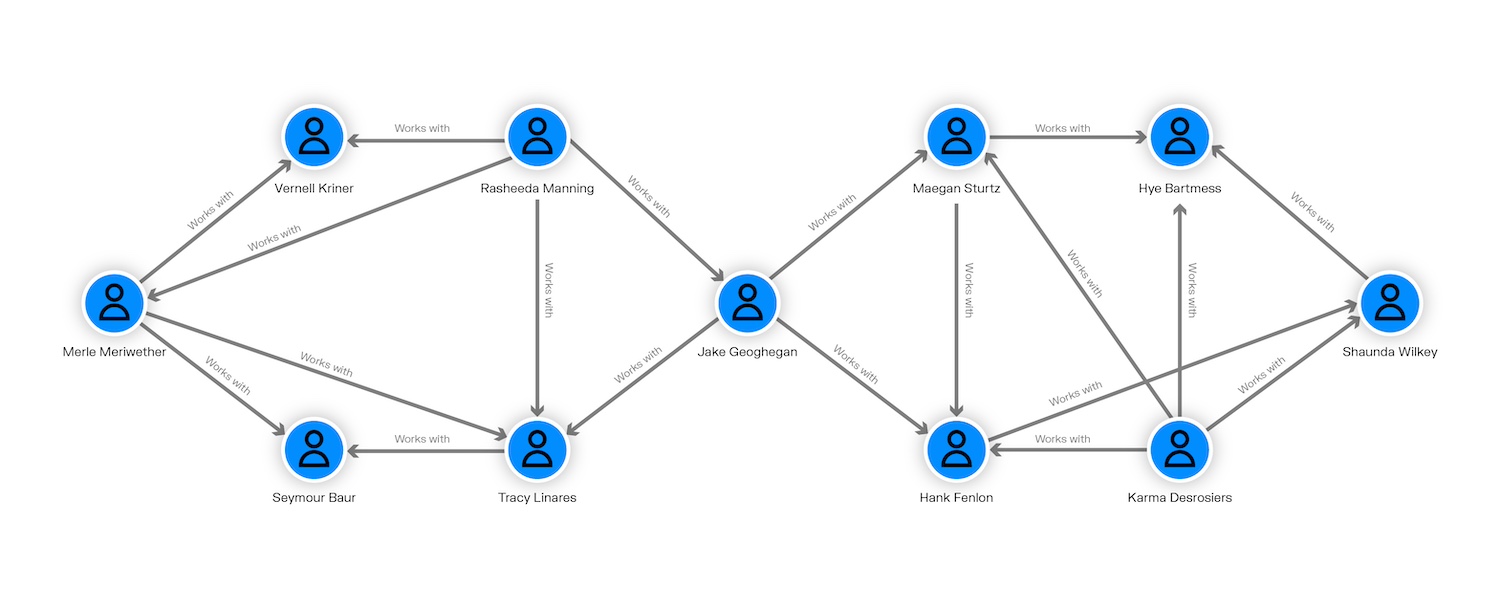
Knowledge graphs generally are made up of datasets from multiple sources, enriching the graph and providing a more complete and nuanced representation of knowledge. In most cases, those data sources have different structures.
To organize this diverse information, knowledge graphs use schemas, or organizing principles, which act as a blueprint for how different types of information should be structured within the graph. Schemas define the types of entities and the kinds of relationships that can exist between them. This framework ensures that as new information is added to the graph, it fits seamlessly into the existing structure.
In their capacity to connect different datasets, display networks, and deliver context, there are several key benefits to working with knowledge graphs.
One of the most significant benefits of knowledge graphs is their ability to bridge the gap between structured and unstructured data. In many organizations, information exists in various formats - from neatly organized databases to free-form text in documents and emails.
Knowledge graphs excel at integrating these diverse data types, allowing for more comprehensive analysis. By connecting structured data with unstructured data, knowledge graphs provide a holistic view that can be difficult to achieve otherwise.
Knowledge graphs help surface complex dependencies and improve efficiency across domains. By linking diverse information sources, they provide an interconnected view of entire systems or processes. This comprehensive perspective helps identify bottlenecks, optimize workflows, and predict potential issues before they arise. By revealing hidden relationships and patterns, knowledge graphs also empower decision-makers to navigate complex scenarios with greater insight and precision.
More recently, knowledge graphs have gained more attention thanks to their ability to enhance generative AI, particularly large language models (LLMs). AI models have become increasingly sophisticated and widely used, but one of the major drawbacks has been hallucinations - incorrect outputs.
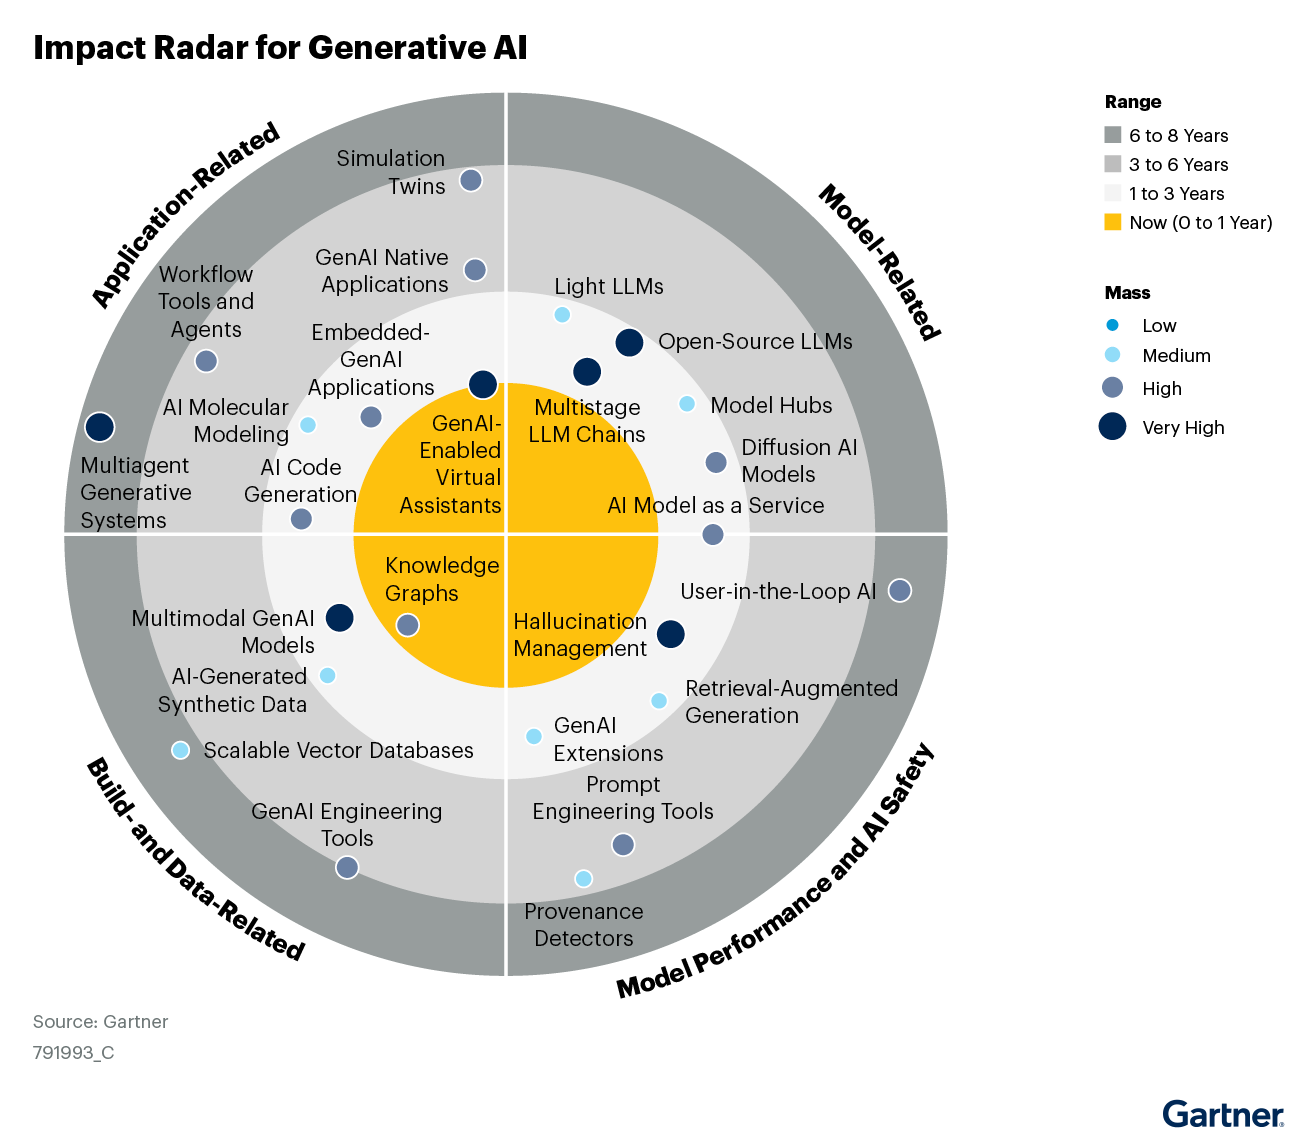
Knowledge graphs help solve this problem, acting as a structured knowledge base that can be used to ground and validate the outputs of LLMs, improving their accuracy and reducing the likelihood of generating false or inconsistent information. The impact of knowledge graphs on generative AI is so promising that Gartner has identified them as having a "high mass" on their Gen AI impact radar.
Knowledge graphs can help improve efficiency and decision making across industries. Below are some (non-exhaustive) examples of the domains where knowledge graphs are making an impact.
The flexible, interconnected structure for organizing and maintaining critical business data makes knowledge graphs a real asset in master data management. They can resolve inconsistencies and create a single source of truth for an organization. Having a unified view enables better data governance, improves data quality, and supports more accurate reporting and analytics. Knowledge graphs’ ability to adapt to changing data structures also makes them ideal for managing complex and evolving master data.
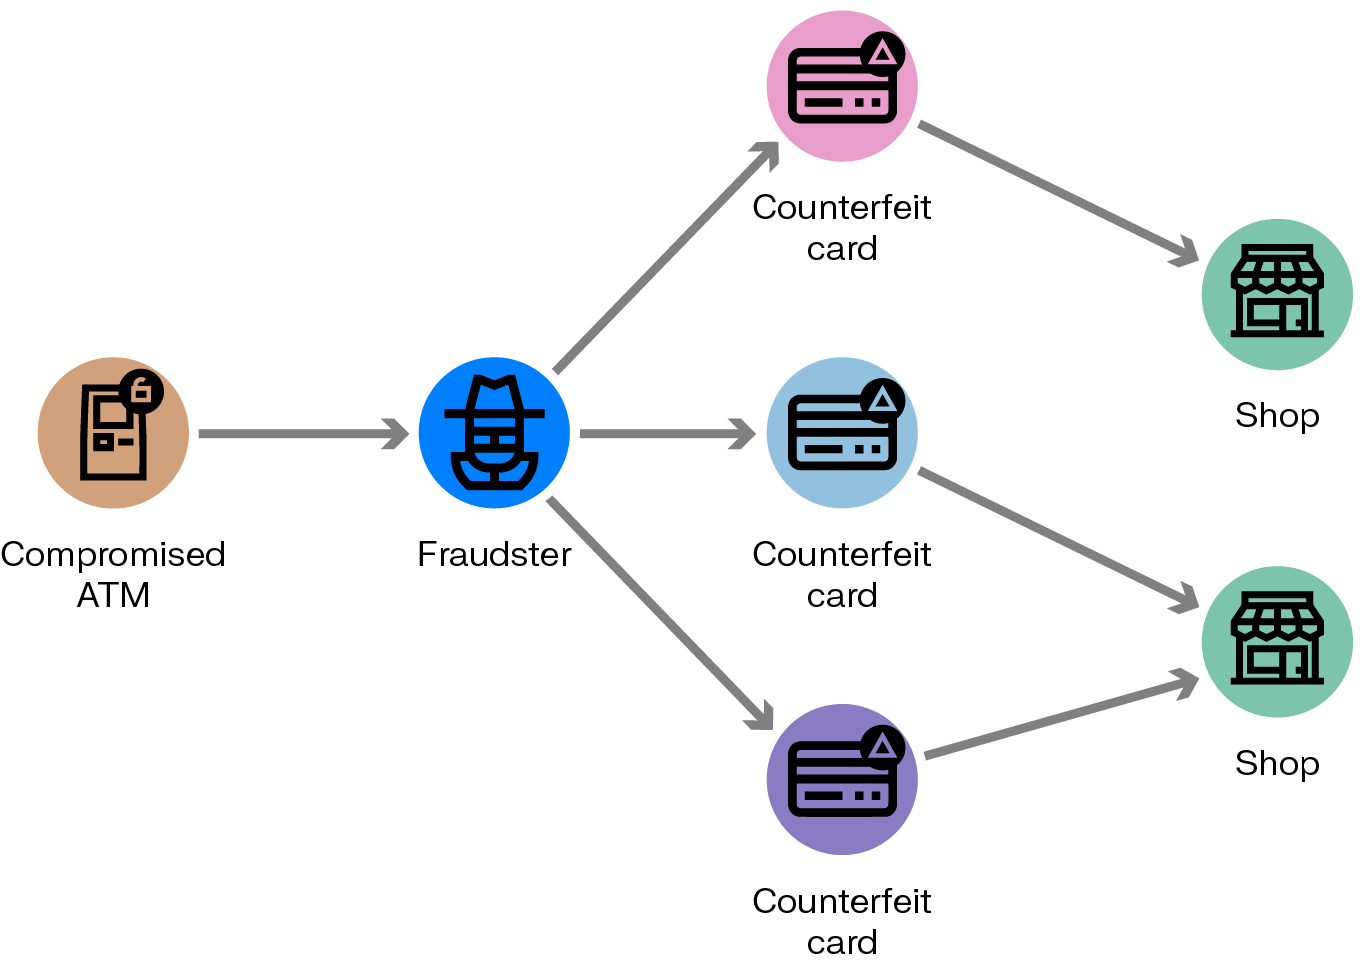
When they are applied in fraud detection, knowledge graphs help investigators uncover hidden connections and patterns that can indicate fraudulent activity. By linking diverse data points, knowledge graphs can reveal suspicious relationships or activities that might go unnoticed using traditional database systems. This holistic view allows for real-time fraud detection and risk assessment, helping financial institutions and other organizations to proactively identify and prevent fraudulent activities.
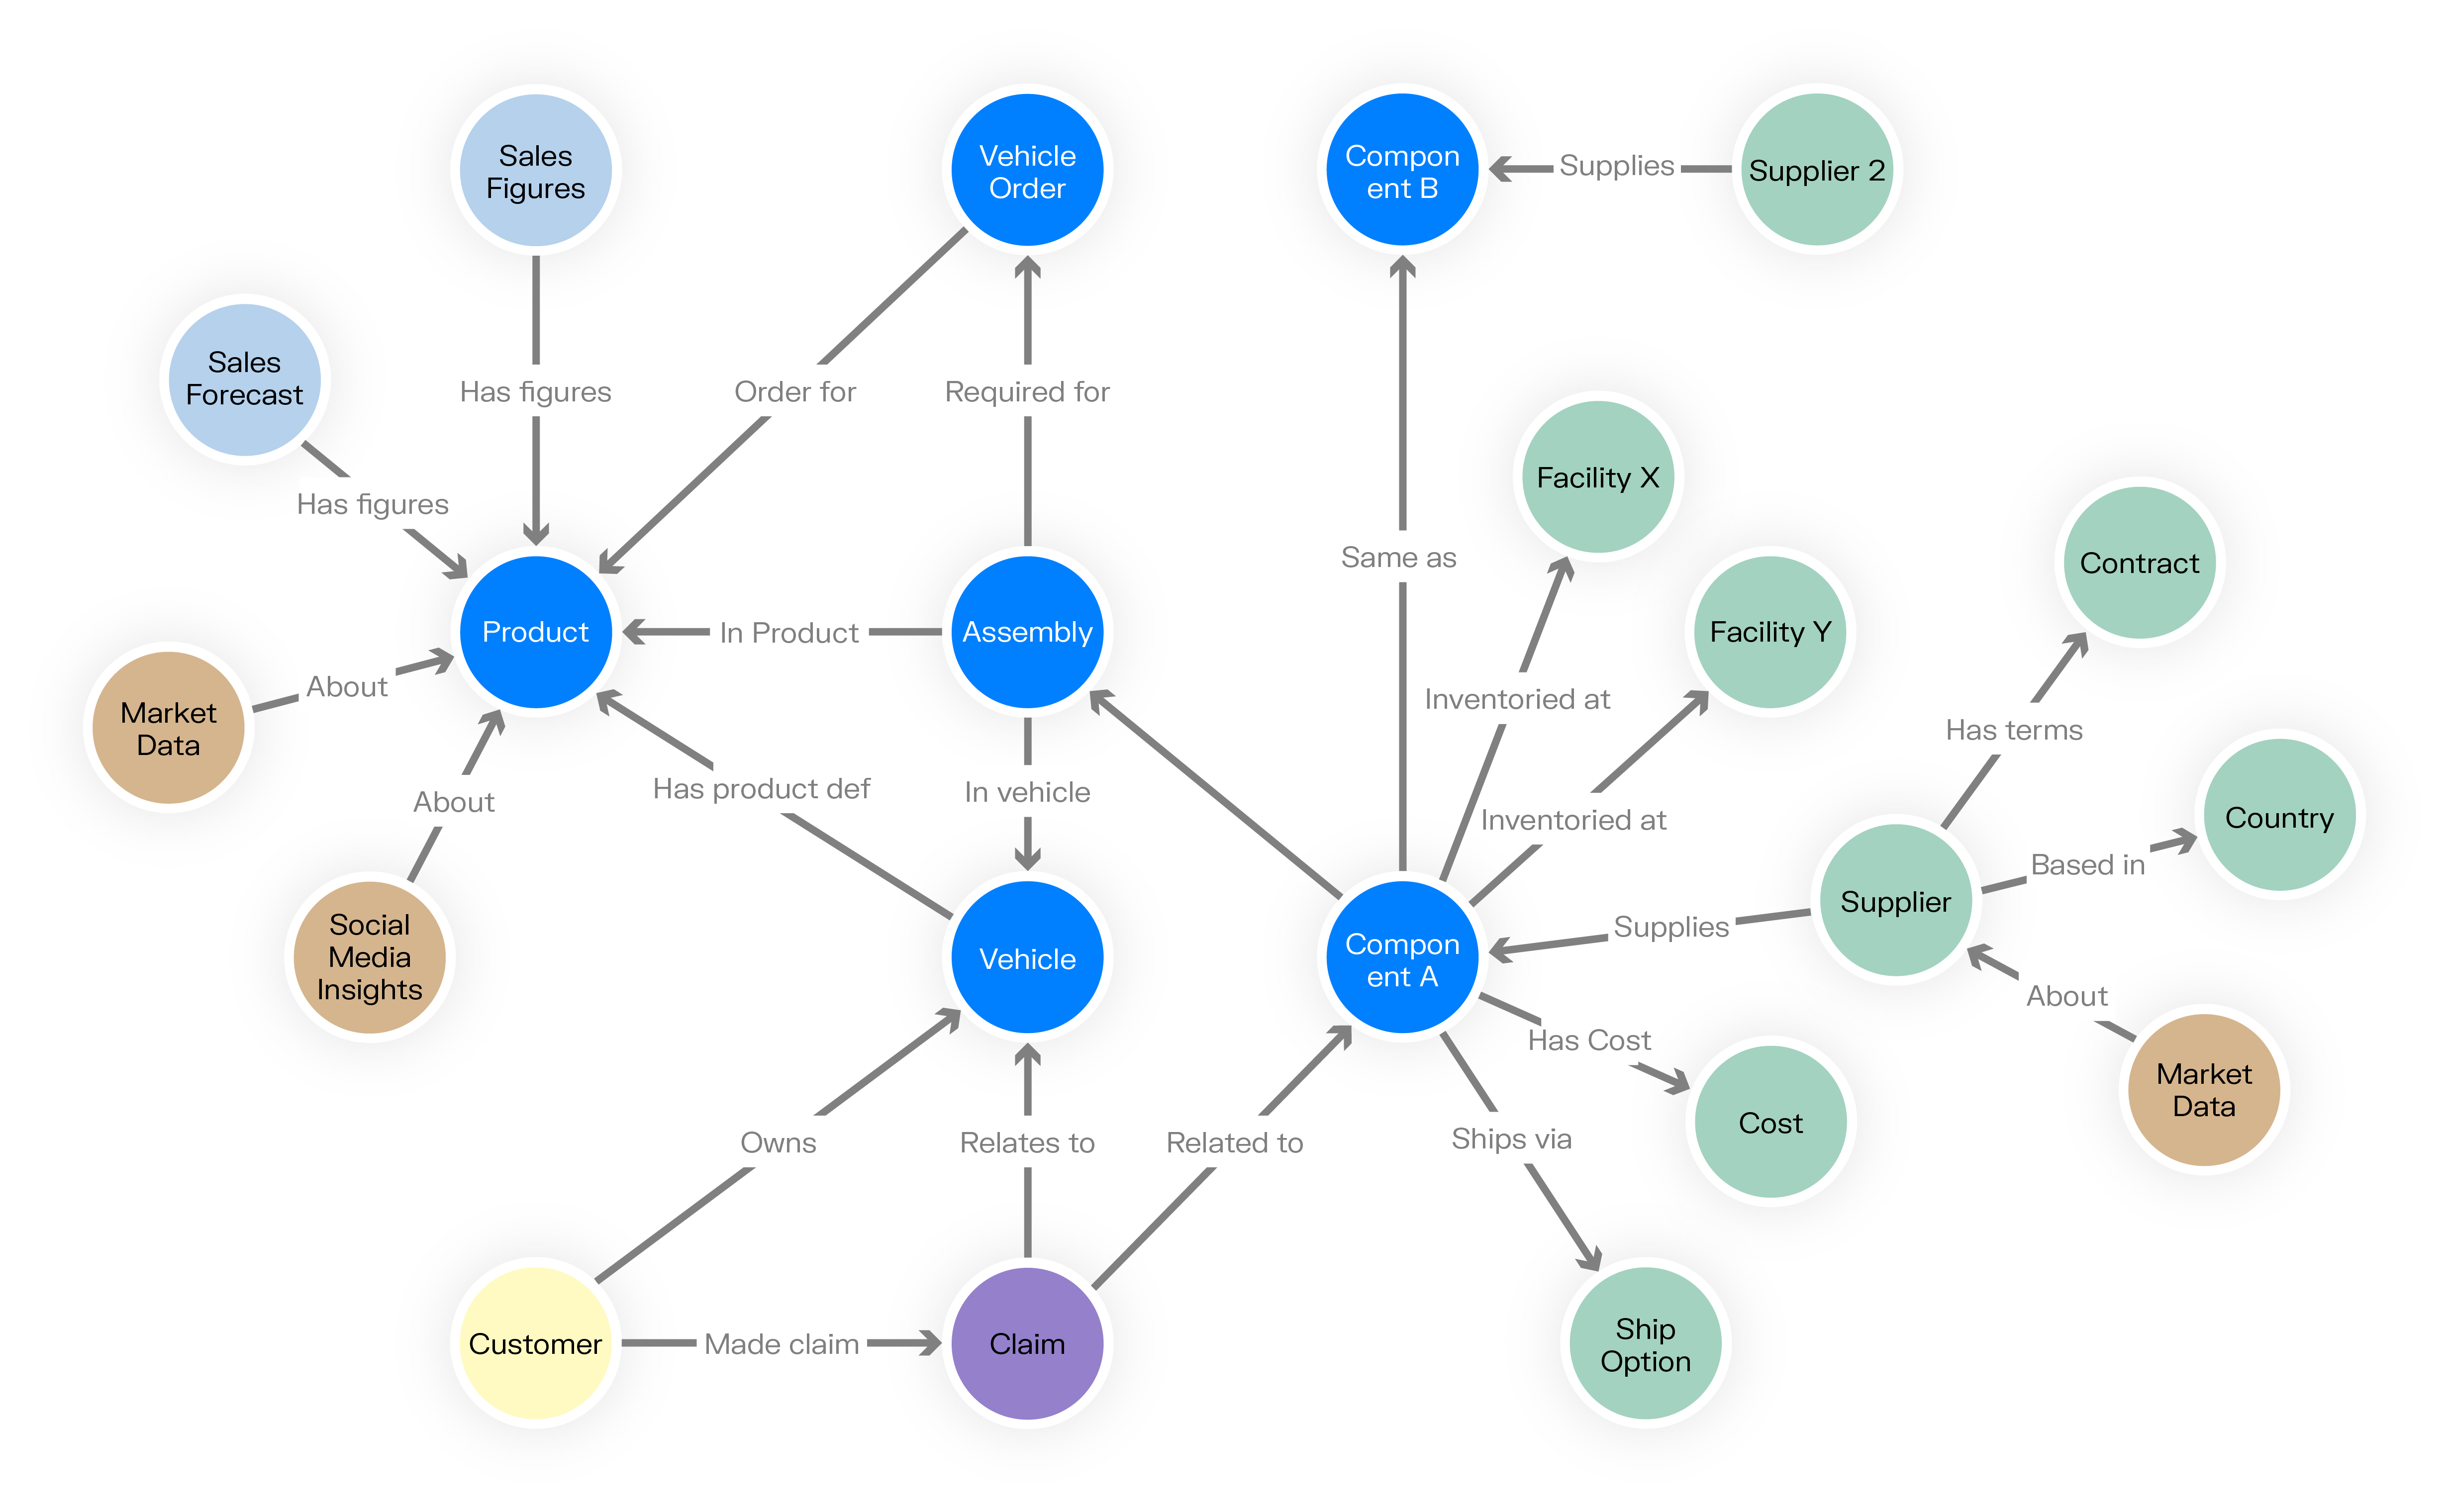
In the context of supply chain management, knowledge graphs provide a comprehensive view of complex global supply networks. They can integrate data from suppliers, logistics providers, inventory systems, and market demand forecasts into a single, interconnected model. This allows for better visibility into the entire supply chain, helping organizations to optimize routes, predict and mitigate disruptions, and make more informed decisions. Knowledge graphs can also help in tracking product origins and ensuring compliance with regulations across different regions.
In biomedical research, knowledge graphs can integrate and analyze vast amounts of scientific data, connecting information from various sources ranging from scientific literature to clinical trials to genetic databases. Bringing together this data can help researchers identify potential drug targets, understand disease mechanisms, and discover new treatments. Knowledge graphs also support personalized medicine by linking patient data with broader medical knowledge, enabling more targeted and effective treatment strategies.
Knowledge graphs enhance cybersecurity efforts by providing a comprehensive view of an organization's security systems, network logs, and threat intelligence feeds. This holistic representation of the security environment allows teams to better understand the relationships between different components of their IT infrastructure, identify vulnerabilities, and detect potential threats. Knowledge graphs can also help track the evolution of cyber threats over time and predict potential future attacks based on historical patterns.
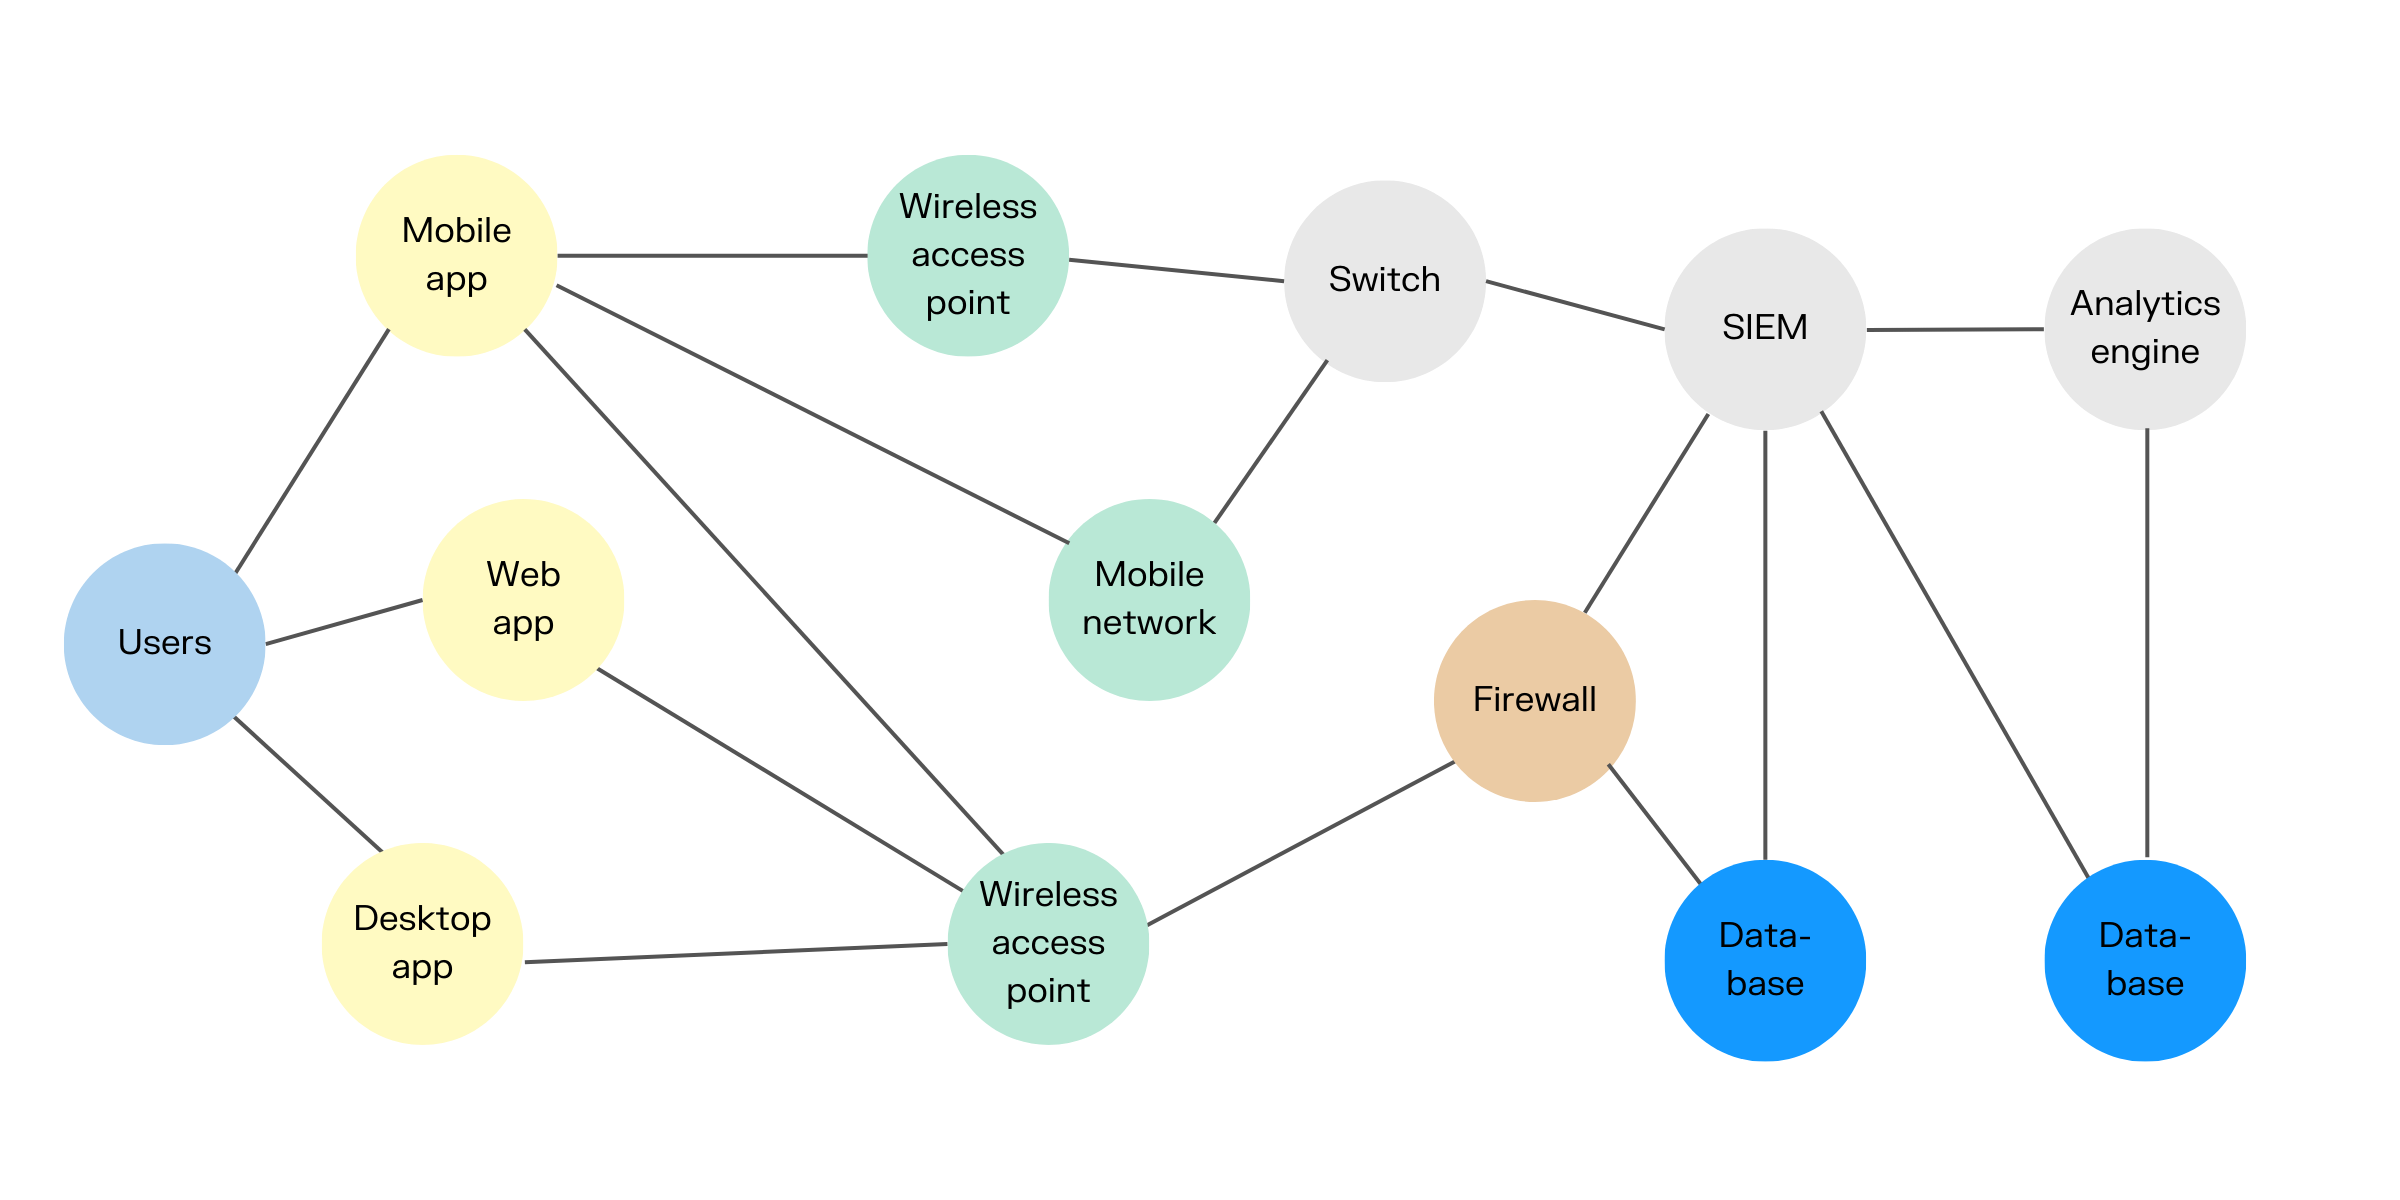
Layering graph visualization onto a knowledge graph lets users gain deeper understanding and a comprehensive view of the complex connections within their data. Knowledge graph visualization depicts a knowledge graph in a visual format, showing you how data is connected in a way that’s easy to process and understand. These visualizations depict entities as nodes (represented by shapes or icons) and relationships as edges (lines or arrows connecting the nodes).
The goal of knowledge graph visualization is to make abstract information concrete and actionable. It allows users to explore data relationships interactively, uncovering insights that might be difficult to discern from raw data or text alone. Whether used for data exploration, decision support, or communication of complex ideas, knowledge graph visualization is a powerful tool for unlocking the full potential of interconnected information across diverse domains.
Read more about knowledge graph visualization.

