Smashing data silos: How to break barriers and unleash the power of your data
Data is a double-edged sword for many businesses. Data analytics is a key piece of the puzzle for organizations to make strategic decisions, improve operations, and ensure security. On the other hand, many organizations find their essential data is trapped in silos: walled off within departments, product lines, geographies, etc.
Because these silos leave decision makers with scattered or limited information, they contribute to limiting growth opportunities and reducing organizational efficiency, while also representing risks for an organization. In a recent study, knowledge workers reported spending nearly 29% of their week (11.6 hours) searching for the key information they need to do their work (1). In short, data silos often keep a business from reaching its full potential.
Ensuring a competitive advantage in today’s digital economy means breaking down data silos. One of the main challenges is change management, since many organizations are reluctant to rework the way they’ve been managing data for years, even if their existing system isn’t working well. Once you have management buy-in, there are several options to technically break down data silos. A graph approach to solving the data dilemma may be one of the most efficient means to unleash the full potential of data. By bringing together diverse data sources and enabling complex analysis across data silos, graph is able to reveal new patterns and insights that would otherwise remain hidden.
In this article, we’ll look at why exactly many organizations experience data silos, the problems they create, and how shifting to a graph data model can help businesses integrate disparate data sources for deeper analysis. We’ll also look at examples of how graphs can be applied to down silos in areas like fraud detection, supply chain management, and more.
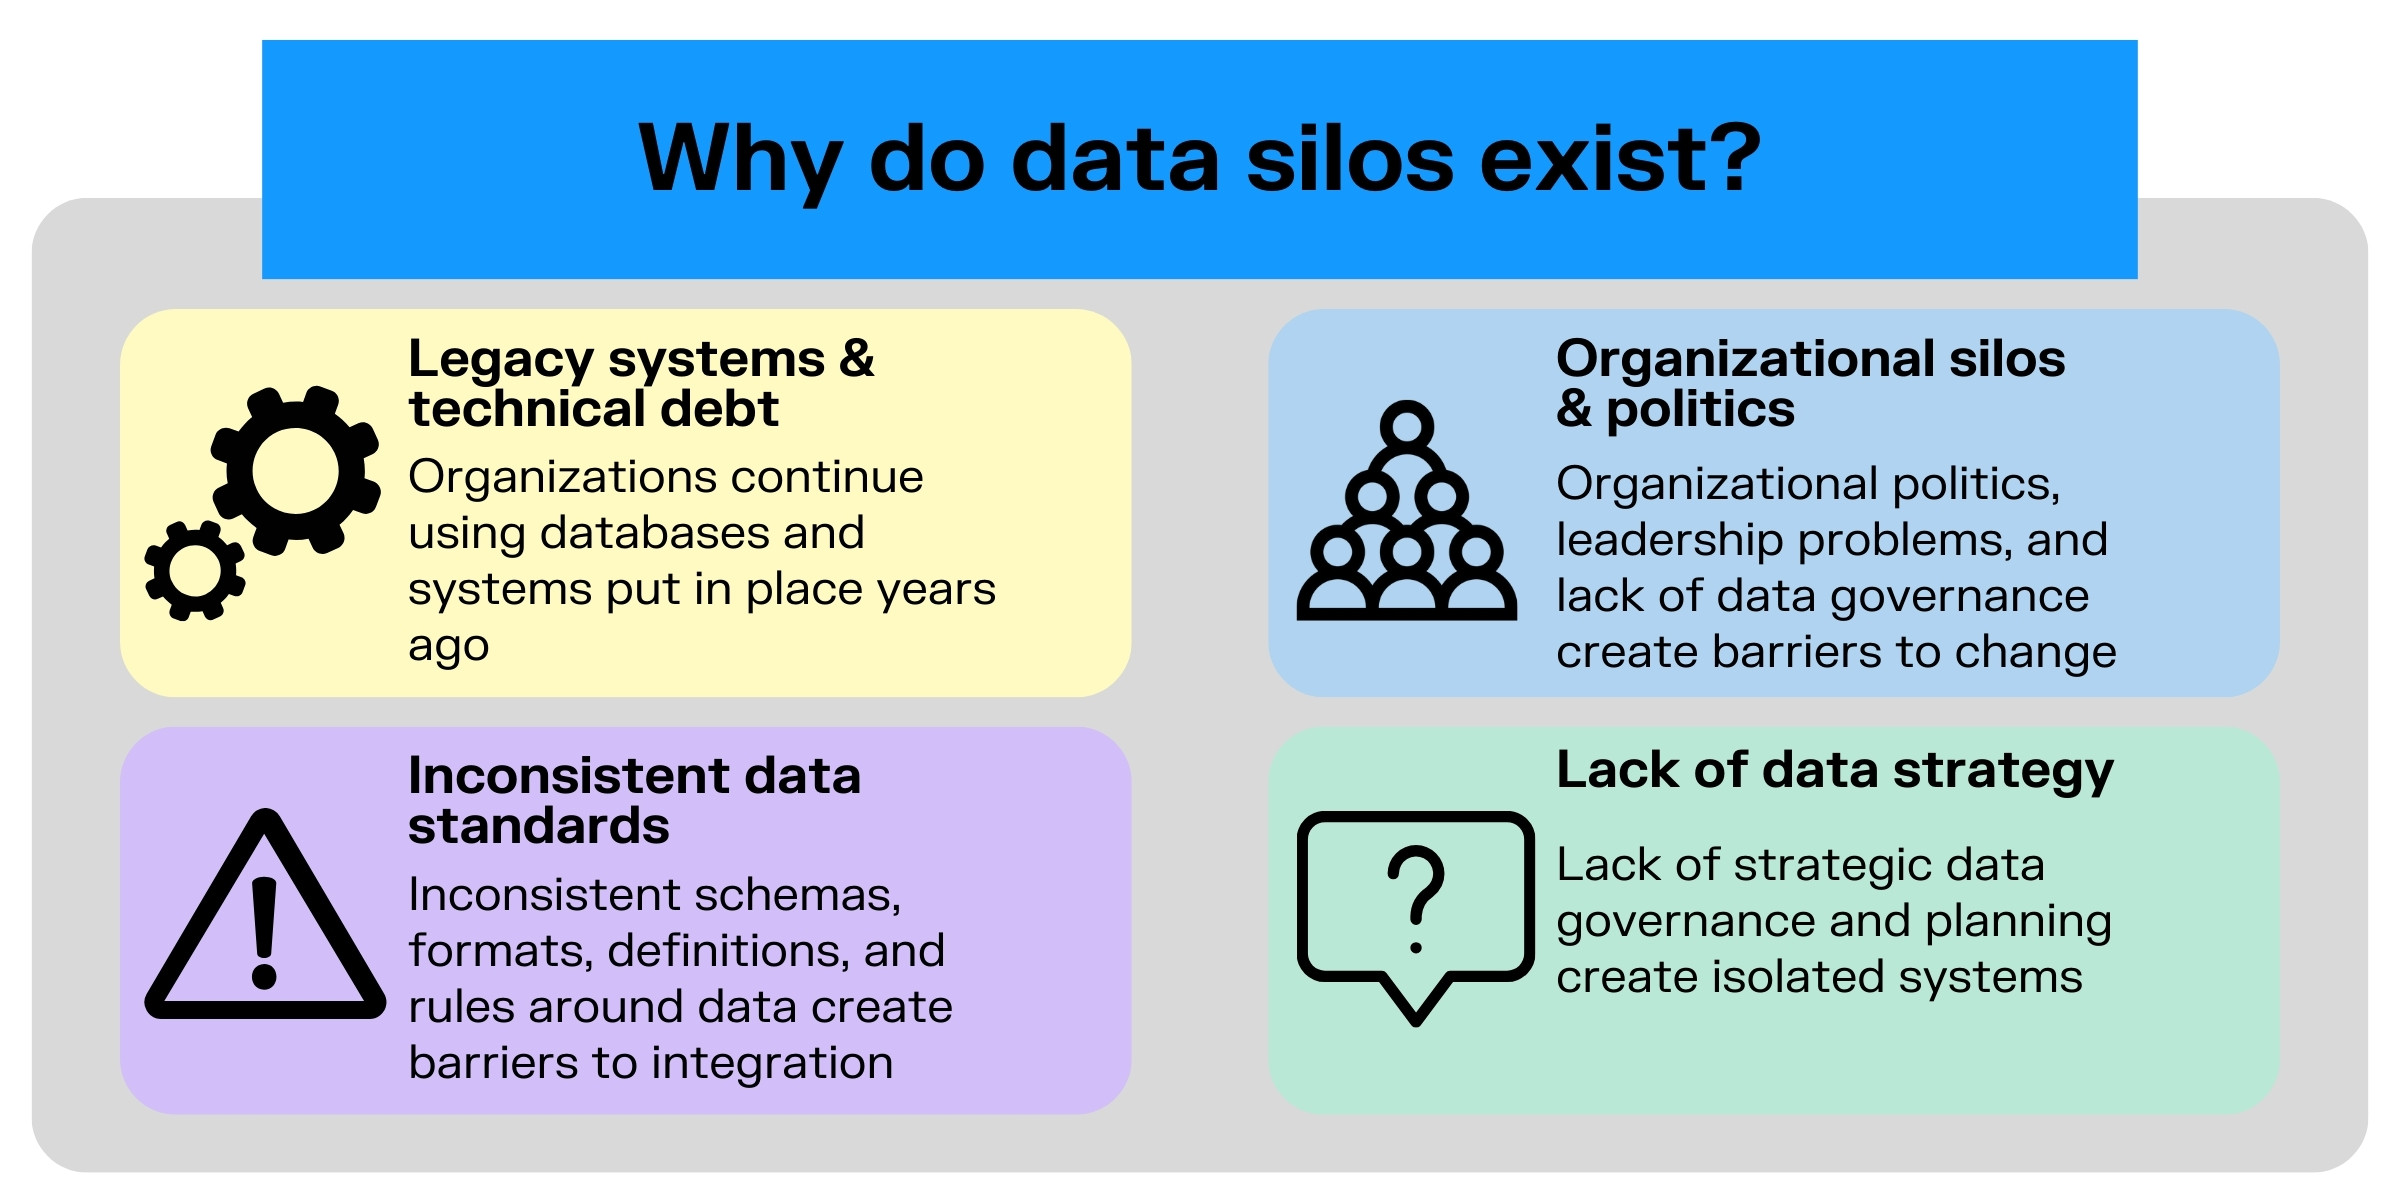
In most cases, multiple factors contribute to the existence of data silos within an organization. Understanding the root causes for siloed data is an important step to bringing an effective solution for better integration. Let’s take a look at some of the most common causes of data silos.

Many organizations have critical business systems and databases that were put into place years ago, and they have surfed along on the status quo. These older technologies make it difficult to connect data across different applications and databases. For example, a company may have customer data spread across a legacy CRM system, a modern cloud database, and an on-premises enterprise data warehouse. Each system likely has its own data schemas, rules, and governance processes that have evolved separately. Trying to extract and integrate the data stored across these various platforms requires custom coding and complex ETL processes. These technical barriers mean that many organizations choose to simply leave information isolated in silos.
Beyond technical limitations, organizational politics and competition within or between departments can also restrict data sharing. When business units don't collaborate, data can become walled off in departmental silos. Employees may be reluctant to share information outside their group, preventing a unified view of customers and business performance. Leadership problems and lack of data governance processes also contribute to organizational silos. Effectively, if leadership doesn’t prioritize or see the value in data integration, it’s unlikely those data silos are going to budge.
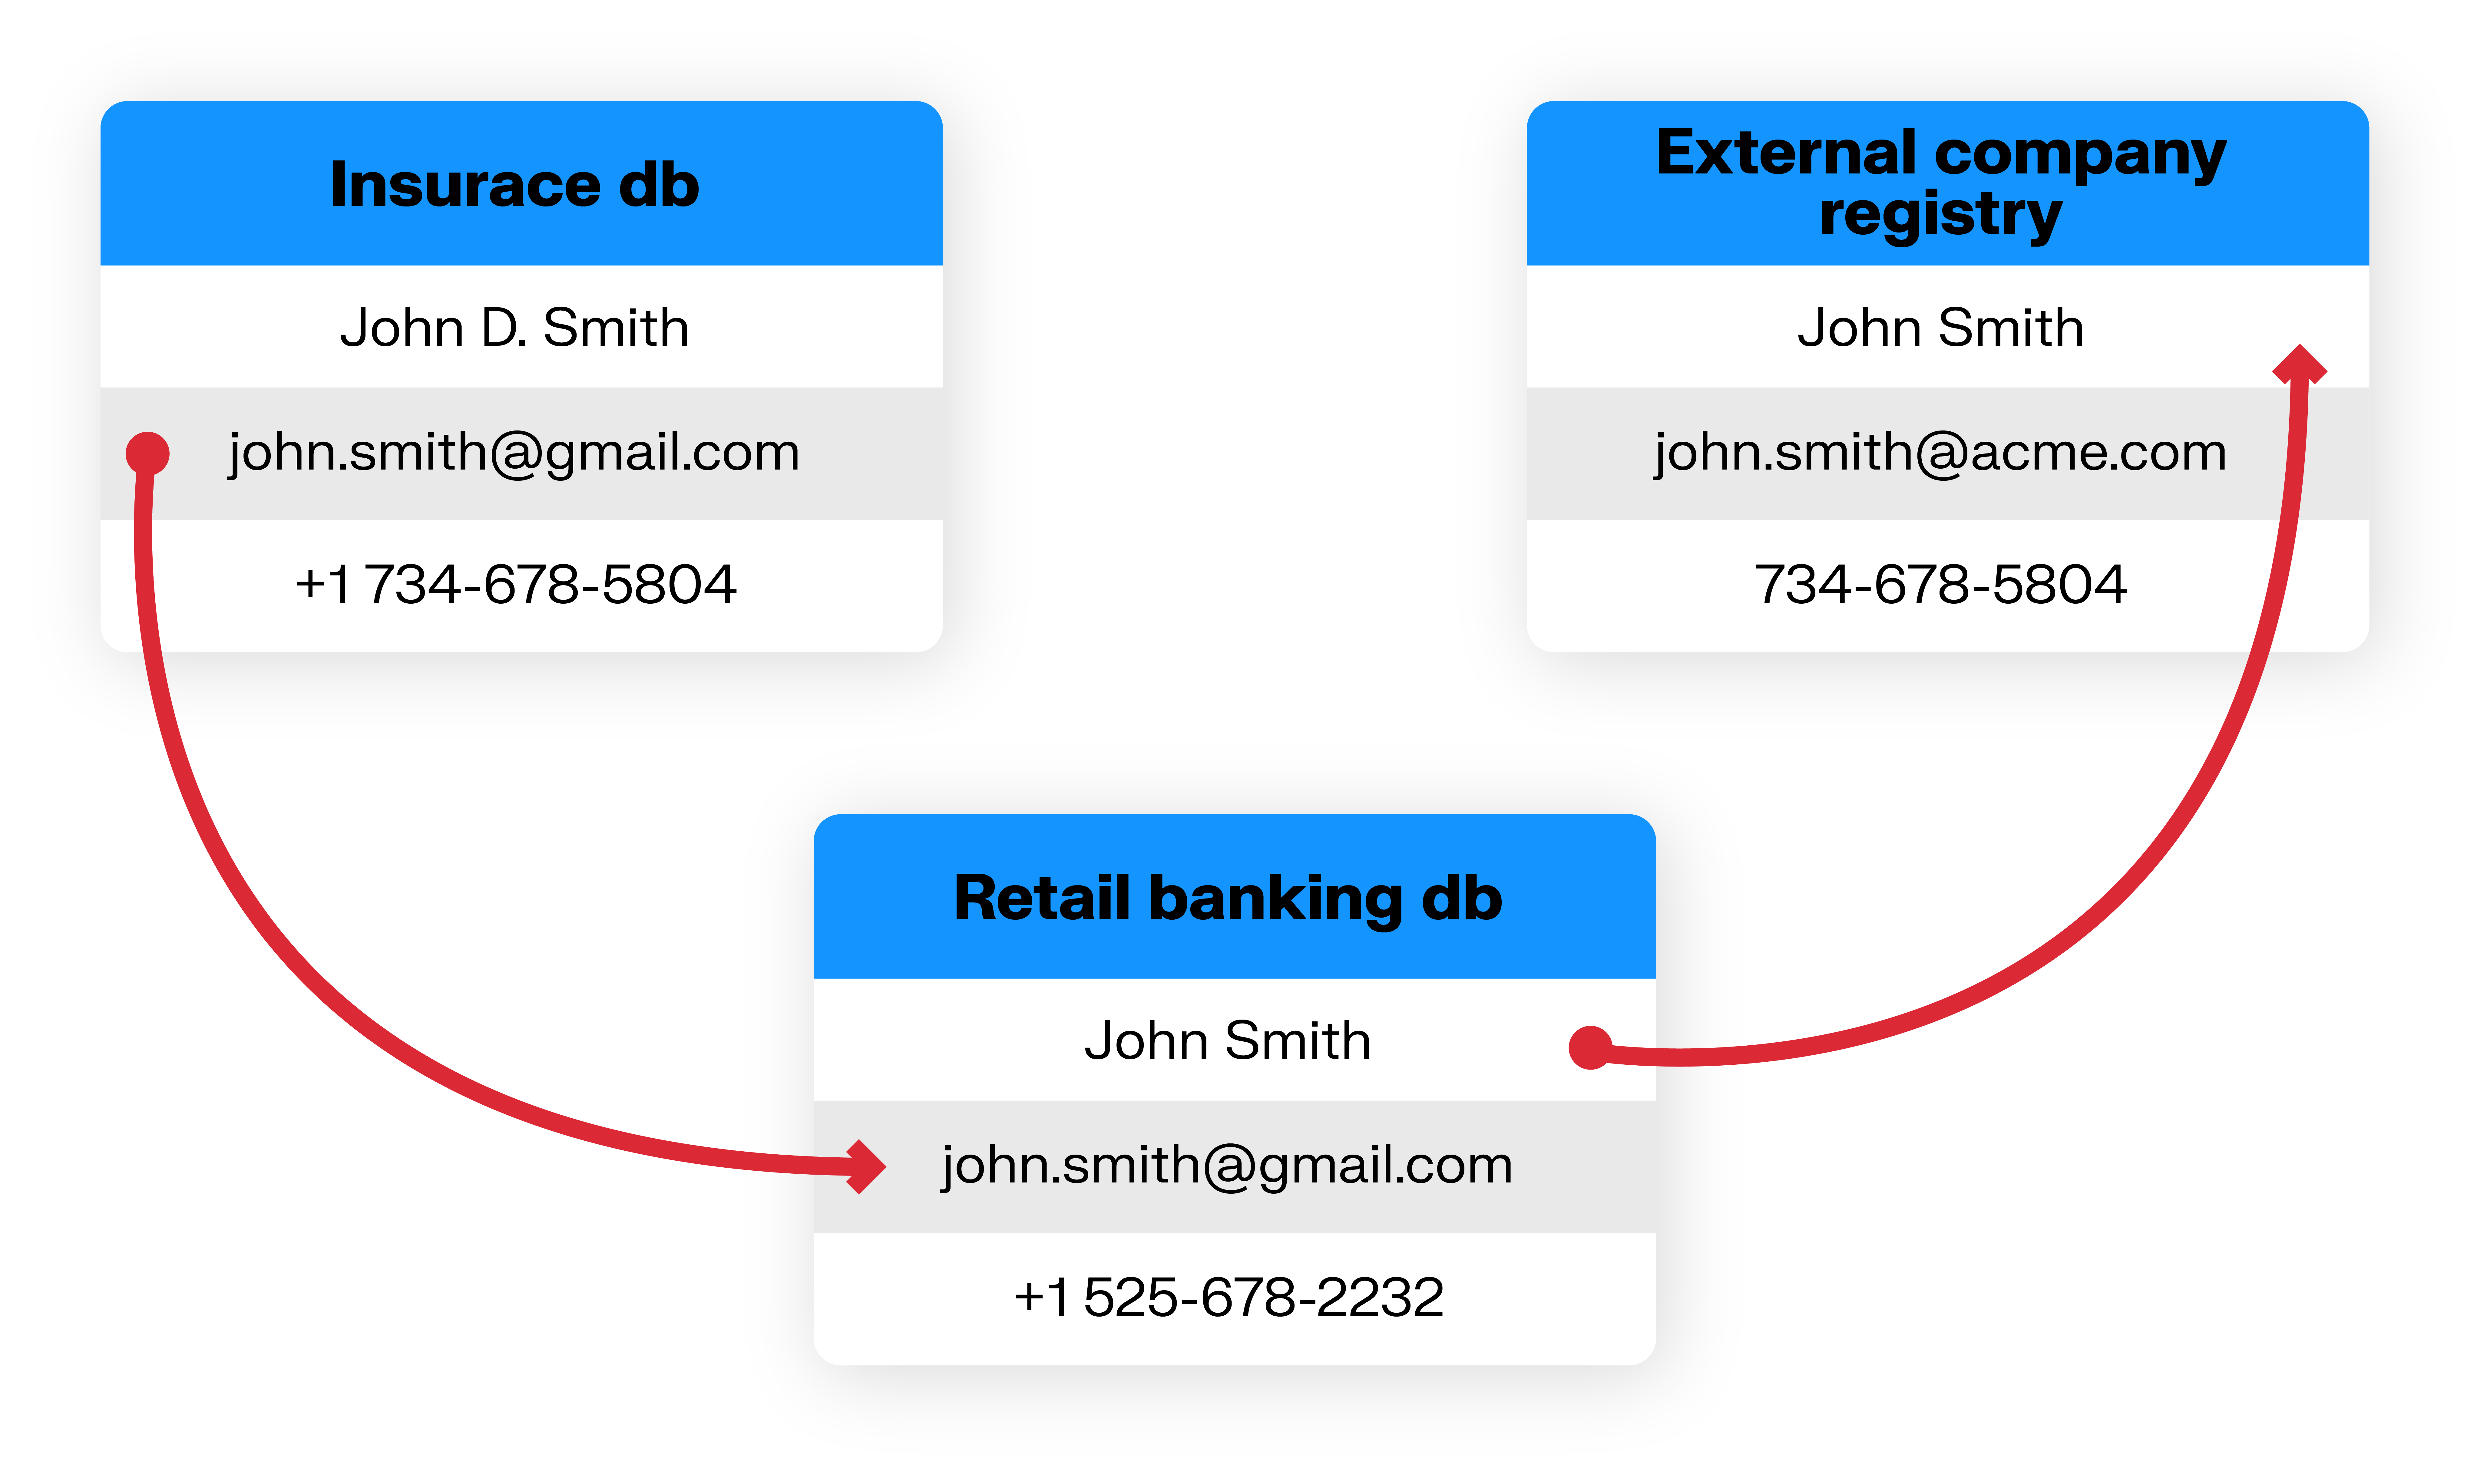
Inconsistent schemas, formats, definitions, and rules around data create barriers to integration. When different systems and teams have their own way of structuring, describing, and managing data, it becomes difficult to reconcile those differences in a unified data environment. For example, two systems may use different formats to capture personal information. These technical and semantic inconsistencies across siloed systems slow down data integration, in turn limiting the insights that can be drawn from the data.
In many cases, the rise of isolated systems and practices is due to lack of strategic data governance and planning. Companies without clear data roadmaps and architectures often end up with disorganized, fragmented data landscapes. This makes it exponentially harder to connect and extract value from data. Planning end-to-end information flows and systems with interoperability in mind can help avoid disconnected silos.
No matter the causes of data silos within an organization, they have real consequences for organizations’ efficiency, productivity, and security.
Without integration, siloed data restricts visibility across the organization. Teams can end up operating in the dark with fragmented data, unsure how their performance connects to the big picture. Siloes conceal systemic issues and risks, potentially leaving organizations vulnerable to security or regulatory issues. And on the flip side, organizations might miss new opportunities hidden in the gaps between siloed datasets.
Silos limit the insights organizations can extract from their data. With data locked away in disparate systems, analysts cannot leverage cross-functional data to identify trends, anomalies, correlations, or predictive patterns. The insights needed to optimize decisions are often hidden away.
Ultimately, fragmented technology landscapes demand more time, labor, and infrastructure to manage. Trying to extract insights across silos tends to require expensive, complex integration and analytics processes.
Data management is in large part a technology problem, requiring a tech solution. But it’s also largely a question of company culture and policy - like we mentioned above. Company culture and data policy is the first place to start when looking to create a real, sustainable solution to siloed data. Without internal alignment and buy-in from management, even the best technology solution is likely to fail.
To break down ingrained silos, leadership needs to clearly communicate the value of cross-functional data sharing and analytics. They should bring different business units together to align on data governance standards and practices. Building cross-functional teams focused on leveraging data enterprise-wide can encourage collaboration. Ongoing training and support also helps drive adoption of new integrated data platforms.
Once you have team buy-in for changing your data management, it’s time to explore how tech can help solve the data dilemma. There are different technology solutions for organizations looking to overcome the challenges of fragmented data. One of the most effective options today is graph technology.
Graph provides flexible data models that can integrate diverse data sources into interconnected information maps.
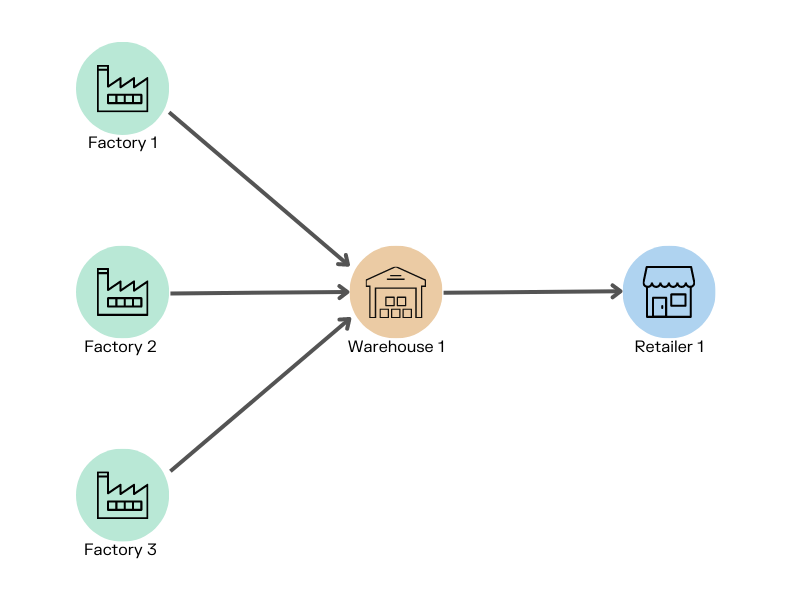
In a graph database, data is structured as a network consisting of nodes (individual data points or entities) and relationships (the connections between those entities). If we take the example of supply chain data, for instance, a supplier node can have relationships to manufacturers, distributors, and more.
Node and relationship models are flexible in a graph data structure, meaning graph databases can map together complex data from across siloed sources. Both structured and unstructured data can be incorporated using custom node definitions, for example. This flexibility is ideal for merging diverse datasets. Graph databases are able to ingest data from multiple sources and databases, simplifying analysis across those sources.

Entity resolution is a key piece of the puzzle in getting value from a diverse array of data sources. Entity resolution, also called data matching, is the process used to determine whether records from one or multiple of these data sources represent the same entity, and then linking those records. It enables you to enhance data quality and build a clear, holistic view of your data.

Graph is well suited to performing entity resolution. Graph analytics provides algorithms that are able to quickly detect common links across different entities to help identify potential duplicates and then group those entities to provide a single source of truth for your decision making.
Legacy data management systems may rely on predefined schema and rigid data categories, making it difficult to see associations and latent patterns spanning different categories of data. In contrast, the flexible graph structure preserves connections between diverse entities.
Graph visualization enables you to visually map out those connections and relationships across different categories of data.
With graph visualization tools, users can interactively explore the graph network, navigating through node and relationship chains. Adding a visual layer to data exploration and analysis also increases the speed of discovery; the human brain processes visual information much more quickly than text or numerical information.
Graph visualization makes it possible to swiftly discover patterns like:
- Pinpointing bottlenecks in supply chains based on interconnected supplier and logistics relationships.
- Detecting signs of fraud or money laundering in financial networks by highlighting suspicious relationships.
- Tracking virus transmission chains in epidemiology by mapping connections between patients, locations, events, etc.
Unlike tabular data representations, graph visualizations enable you to spot critical hubs, clusters, and other patterns. Graphs intuitively display the natural interconnectedness within data, revealing crucial insights. Organizations can capitalize on this relationship perspective to improve decision making across the enterprise.
We’ve taken a look at why graph analytics and visualization is well suited to data integration in general. But how does this technology actually apply in the real world for organizations across industries looking to break down information silos? Here are just a few use cases.
Fraudsters are always looking for new ways to exploit banks and payment systems. Detecting sophisticated fraud requires analyzing many different types of data to spot suspicious patterns: transactional data, behavioral data, communication data, and more. Many fraudsters work in professionalized networks, so fraud patterns can be complex, involving multiple entities, geographies, etc. They also evolve frequently as fraudsters seek out new opportunities. A graph solution can ingest data from all these data sources and visualize relationships to identify potential fraud schemes and networks.
Modern network infrastructure consists of many interconnected components, including servers, applications, network devices, cloud services, and more. Graph databases can ingest configuration data from all these systems and provide a flexible map of relationships and dependencies. This enables better network management, complex root cause analysis, and impact analysis when issues occur. Gaining better visibility and understanding of your organization’s network infrastructure also enhances security by helping locate weak points, identify key risks and dependencies, and perform impact analysis in case of an attack.
Global supply chains can be immensely complex, involving orchestrating goods, information, and payments across a web of vendors, logistics providers, regulatory agencies, and beyond. One hitch in the system can cause problems throughout the supply chain and seriously impact a business’s bottom line. Modeling the end-to-end supply network in a graph makes it possible to identify bottlenecks, streamline processes, and simulate changes to improve efficiency and resiliency.
The connectivity and relationships modeled in graph databases are a natural fit for mapping real-world domains into insightful data networks. Organizations across industries can leverage graphs to gain unified visibility and analysis.
The risks and missed opportunities caused by fragmented, siloed data are too great to ignore in today's competitive and data-driven business environment. While legacy systems and ingrained data practices have led to disconnected data landscapes, new technologies like graph technology offer a powerful solution. By flexibly modeling data as networks, graphs can integrate disparate data sources into unified maps that reflect the complexity of real-world connections.
With the ability to map data relationships, run complex contextual queries, and visually explore connections, graph databases unlock deep insights trapped within traditional silos. Forward-thinking organizations across industries are leveraging these capabilities to detect sophisticated fraud earlier, optimize supply chains, govern data, and more. To thrive in the era of connected data, businesses should consider graph technologies as a way to finally tear down data silos and start realizing the full value of their information capital.
(1) https://venturebeat.com/data-infrastructure/report-data-silos-cause-employees-to-lose-12-hours-a-week-chasing-data/
A spotlight on graph technology directly in your inbox.


